Open Access
Fig. 1.
Download original image
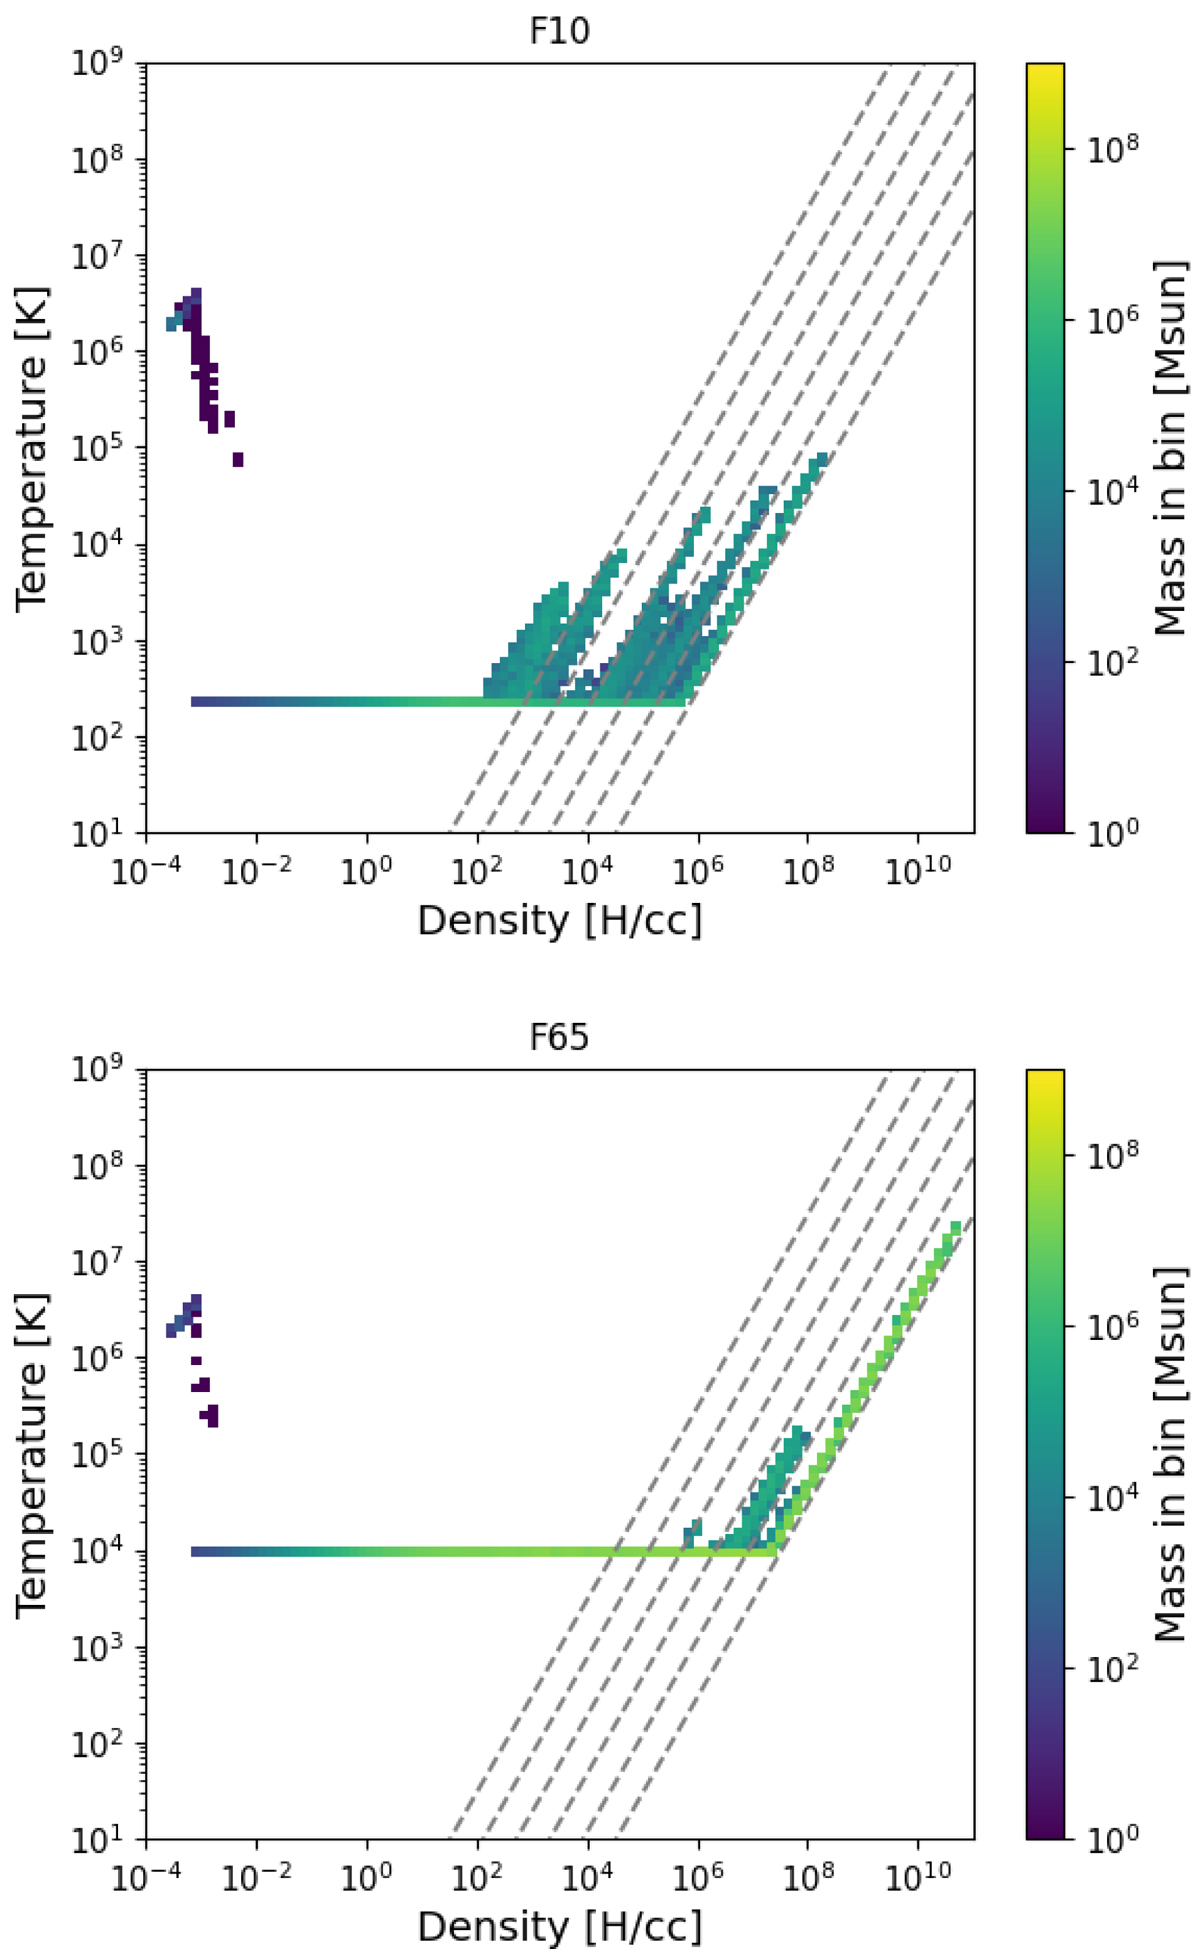
Density-temperature diagrams for the zoomed regions, 10 Myr of evolution after the activation of level 20. The dashed lines show the minimum pressure floor to satisfy the Truelove et al. (1997) criterion for levels 15–20, from left to right. This pressure floor is smoothly reduced towards the centre of the zoom (see text).
Current usage metrics show cumulative count of Article Views (full-text article views including HTML views, PDF and ePub downloads, according to the available data) and Abstracts Views on Vision4Press platform.
Data correspond to usage on the plateform after 2015. The current usage metrics is available 48-96 hours after online publication and is updated daily on week days.
Initial download of the metrics may take a while.