Fig. 8
Download original image
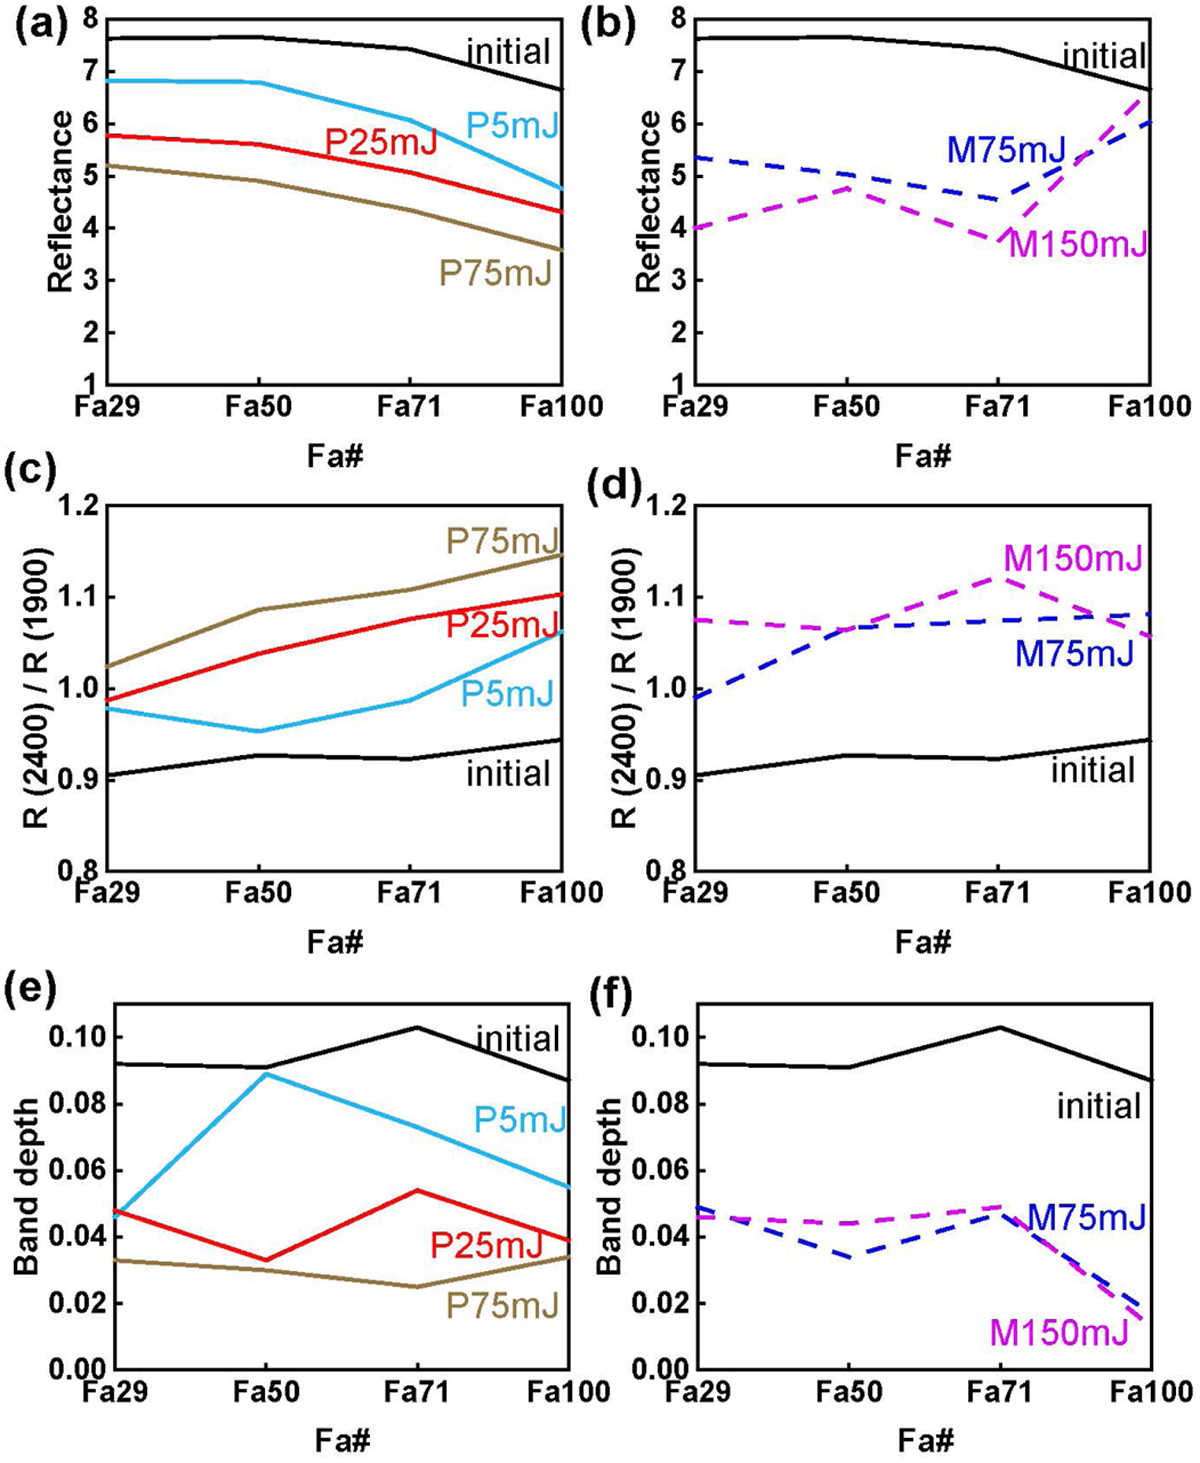
Variations in NIR spectral parameters with increasing Fa# values of olivine under different irradiation energy conditions. Images (a) and (b) R1900; (c) and (d) R2400/R1900; (e) and (f) BD1000. The initial olivine is shown in black. Images (a), (c), and (e) show irradiations simulating Phobos conditions, P5mJ (teal line), P25mJ (red line), and P75mJ (brown line). Images (b), (d), and (f) show irradiations simulating Moon conditions, M75mJ (blue dashed line) and M150mJ (purple dashed line). Under Phobos conditions, the decrease in reflectance and increase in R2400/R1900 spectral slope are approximately parallel to the initial olivine with increasing Fa# values. Variations in band depth occured in different Fa# samples, but overall the band depth attenuated after irradiations. Under the Moon conditions, the changes in reflectance, R2400/R1900 spectral slope change, and band depth generally followed the trends of initial olivine, with exceptions in Fa100-M75mJ and -M150mJ.
Current usage metrics show cumulative count of Article Views (full-text article views including HTML views, PDF and ePub downloads, according to the available data) and Abstracts Views on Vision4Press platform.
Data correspond to usage on the plateform after 2015. The current usage metrics is available 48-96 hours after online publication and is updated daily on week days.
Initial download of the metrics may take a while.