Fig. 6
Download original image
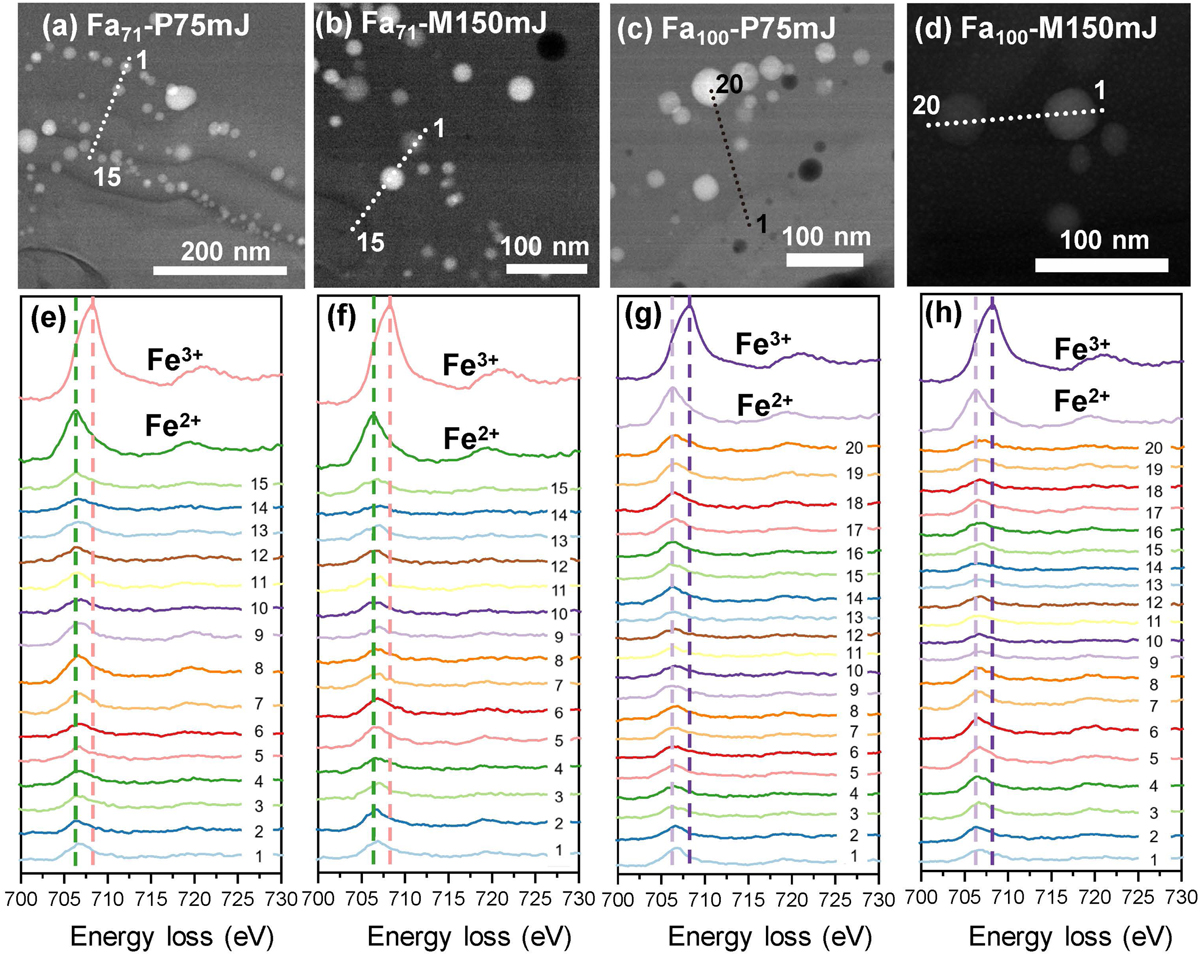
TEM-EELS line scan analysis and the corresponding spectrum results of Fa71 -P75mJ, Fa71 -M150mJ, Fa100-P75mJ, and Fa100-M150mJ samples. Twenty points were sampled on Fa71 -P75mJ and Fa71 -M150mJ samples, and fifteen points were sampled for Fa100-P75mJ and Fa100-M150mJ samples. Analysis points of the samples are shown in the top row, and the corresponding Fe L3,2 TEM-EELS data for samples and standard references are shown in the bottom row. Images (a) and (e) Fa71 -P75mJ; (b) and (f) Fa71 -M150mJ; (c) and (g) Fa100-P75mJ; (d) and (h) Fa100-M150mJ. The standard references show that Fe2+ and Fe3+ have distinct edge shapes and peak positions at 706.2 eV and 708 eV, respectively. The TEM-EELS line scan shows that the Fe in olivine and the matrix existed as Fe2+, and no evidence of Fe3+ was found.
Current usage metrics show cumulative count of Article Views (full-text article views including HTML views, PDF and ePub downloads, according to the available data) and Abstracts Views on Vision4Press platform.
Data correspond to usage on the plateform after 2015. The current usage metrics is available 48-96 hours after online publication and is updated daily on week days.
Initial download of the metrics may take a while.