Fig. 2
Download original image
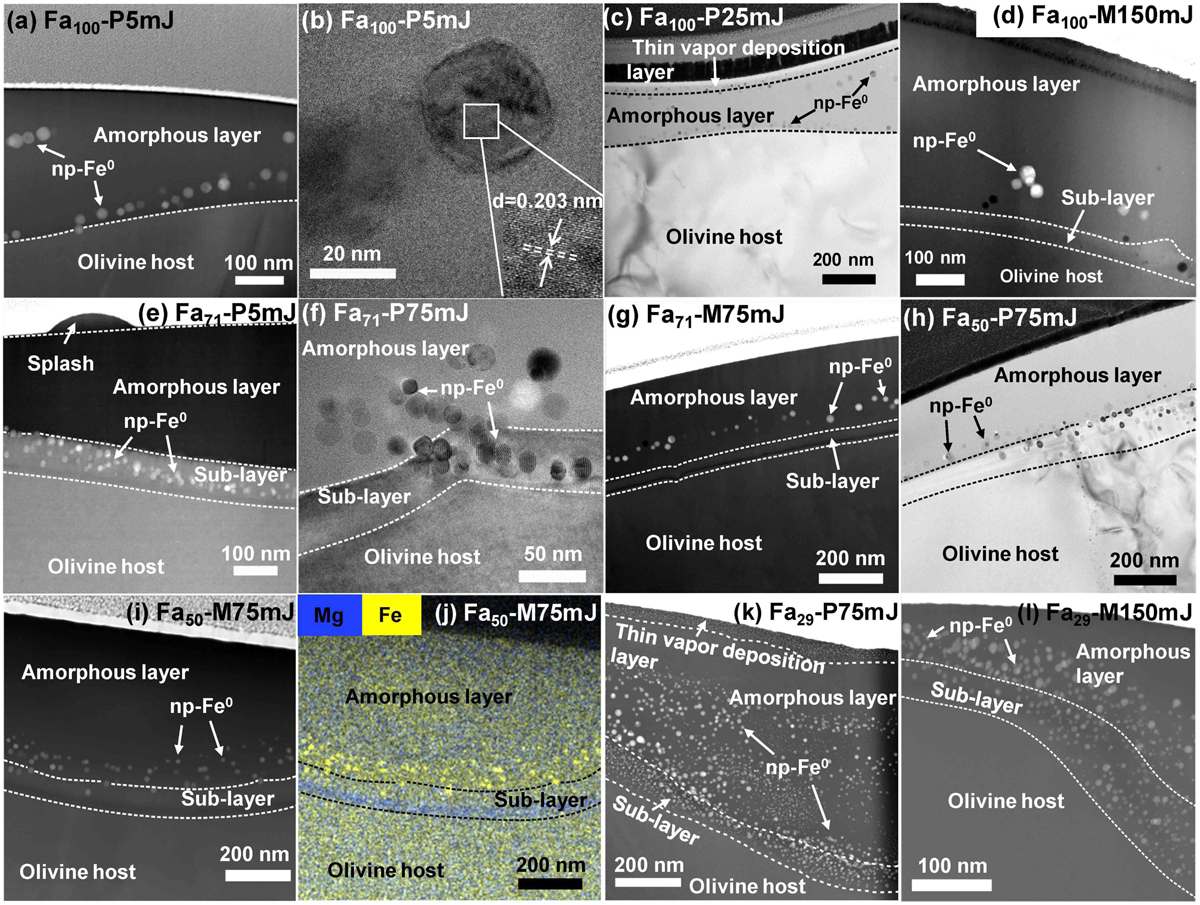
TEM images of different layered structures. Image (a) Fa100-P5mJ with a two-layer structure: amorphous layer plus olivine host. Image (b) High-resolution TEM image of np-Fe0 distributed in the middle and bottom of the amorphous layer in image (a). The interplanar spacing is d = 0.203 nm, which is consistent with a crystal lattice plane (110) of α-Fe. Image (c) Fa100-P25mJ with a three-layer structure: vapor deposition layer plus amorphous layer plus olivine host. Image (d) Fa100-M150mJ with a three-layer structure: amorphous layer plus subsolidus layer plus olivine host that differs from that of image (c). Image (e) Fa71 -P5mJ, (f) Fa71 -P75mJ, (g) Fa71-M75mJ, (h) Fa50-P75mJ, and (i) Fa50-M75mJ in which the three-layer structure represents most of the samples: amorphous layer plus subsolidus layer plus olivine host. Image (j) EDS mapping of (i) showing the elemental distribution of Mg and Fe. Image (k) represents the characteristics of Fa29 in the energy range from P5mJ to M75mJ and with a four-layer structure: vapor deposition layer plus amorphous layer plus subsolidus layer plus olivine host. Image (1) shows Fa29-M150mJ with a three-layer structure: amorphous layer plus subsolidus layer plus olivine host. This figure shows the variation in the layer structure produced by olivine with different iron contents at different energy levels.
Current usage metrics show cumulative count of Article Views (full-text article views including HTML views, PDF and ePub downloads, according to the available data) and Abstracts Views on Vision4Press platform.
Data correspond to usage on the plateform after 2015. The current usage metrics is available 48-96 hours after online publication and is updated daily on week days.
Initial download of the metrics may take a while.