Fig. 1
Download original image
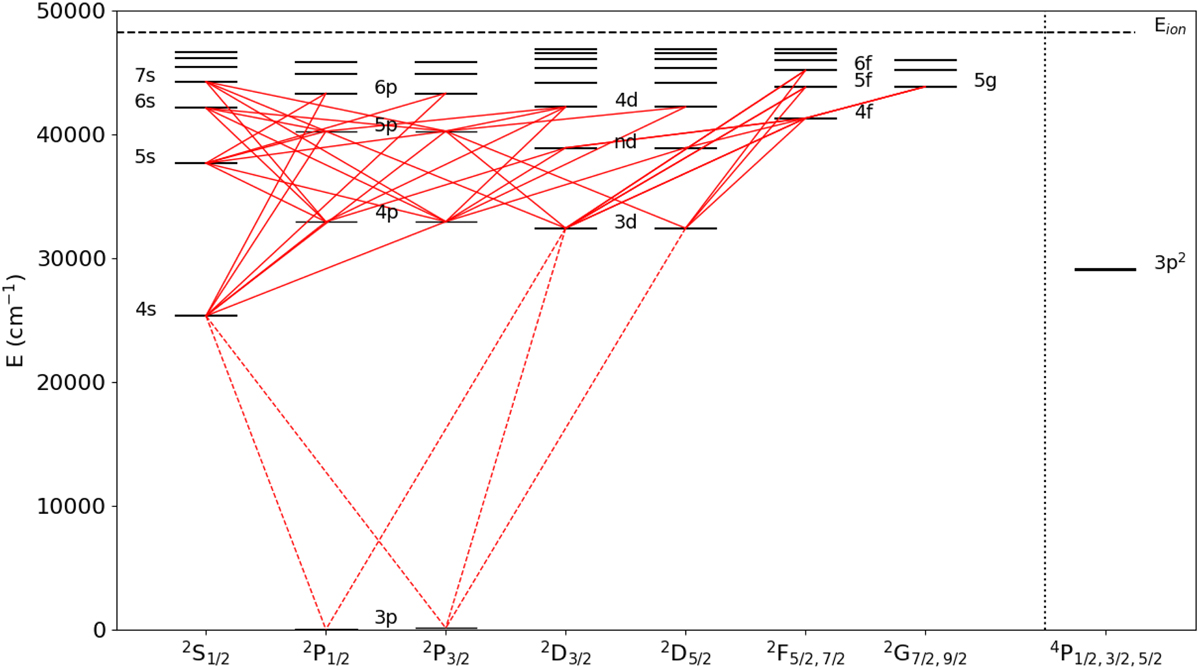
Partial energy level diagram of Al I with excitation energy (in cm−1) on the vertical axis and the different terms in LS notation along the horizontal axis. The red lines represent transitions observed in this project. The dashed red lines are transitions that were observed but not included in the analysis. Dashed black line at the top represents the ionisation energy.
Current usage metrics show cumulative count of Article Views (full-text article views including HTML views, PDF and ePub downloads, according to the available data) and Abstracts Views on Vision4Press platform.
Data correspond to usage on the plateform after 2015. The current usage metrics is available 48-96 hours after online publication and is updated daily on week days.
Initial download of the metrics may take a while.