Open Access
Fig. 4
Download original image
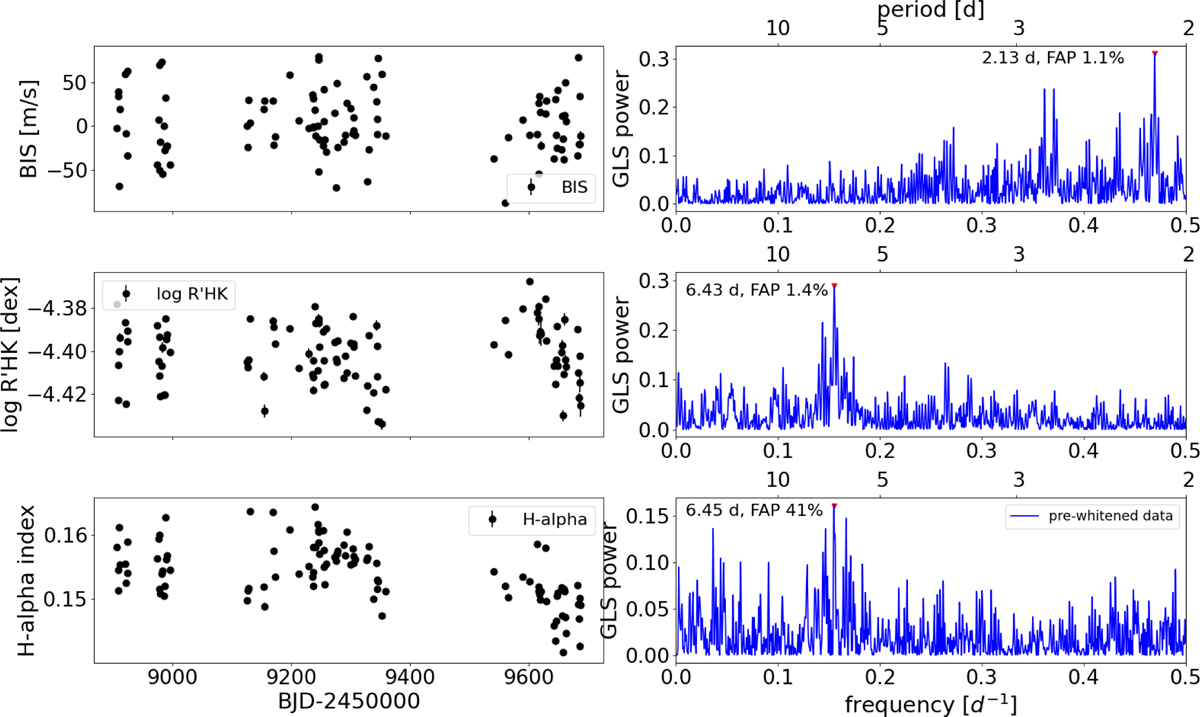
Time series (left column) and periodograms (right column) of spectroscopic activity diagnostics. The periodogram of the H-alpha index refers to pre-whitened data, after removing the long-term curvature visible in the time series. FAPs are calculated through a bootstrap analysis.
Current usage metrics show cumulative count of Article Views (full-text article views including HTML views, PDF and ePub downloads, according to the available data) and Abstracts Views on Vision4Press platform.
Data correspond to usage on the plateform after 2015. The current usage metrics is available 48-96 hours after online publication and is updated daily on week days.
Initial download of the metrics may take a while.