Open Access
Fig. 1
Download original image
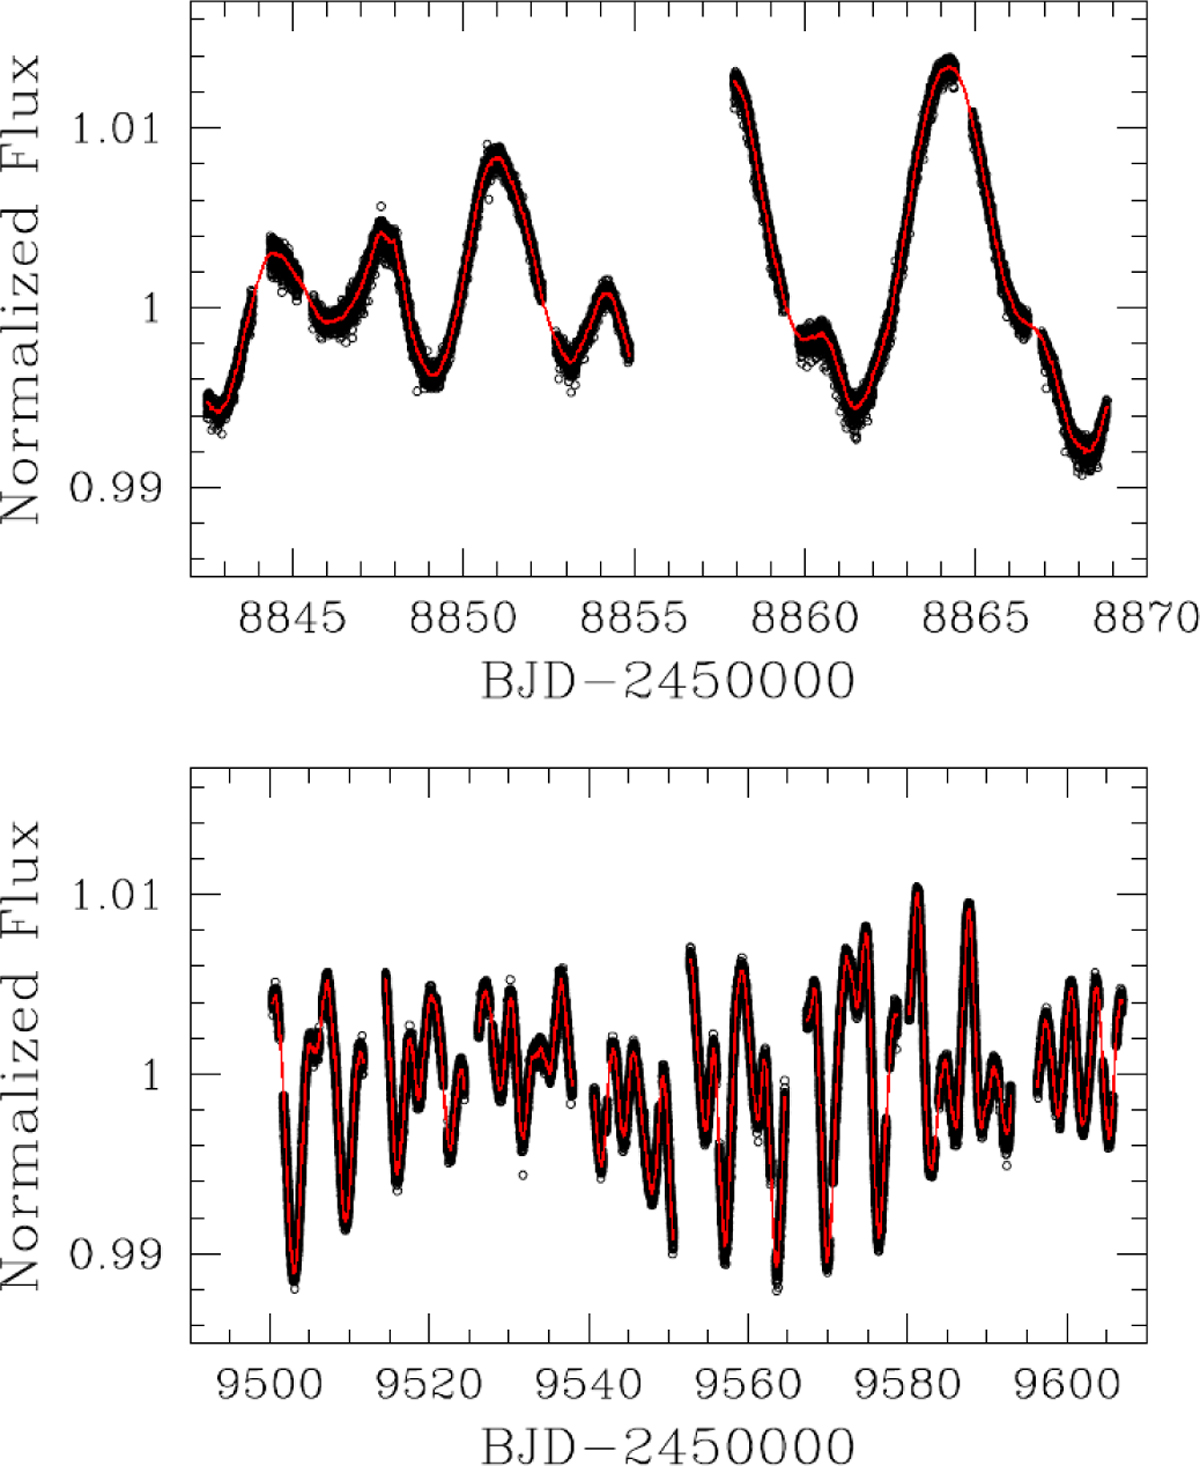
TESS light curve of HD 63433 for Sector 20 (upper panel), and Sectors from 44 to 47 (lower panel). Planetary transits and bad-quality points have been removed from the dataset. The red curve represents the best-fit GP model.
Current usage metrics show cumulative count of Article Views (full-text article views including HTML views, PDF and ePub downloads, according to the available data) and Abstracts Views on Vision4Press platform.
Data correspond to usage on the plateform after 2015. The current usage metrics is available 48-96 hours after online publication and is updated daily on week days.
Initial download of the metrics may take a while.