Fig. 8.
Download original image
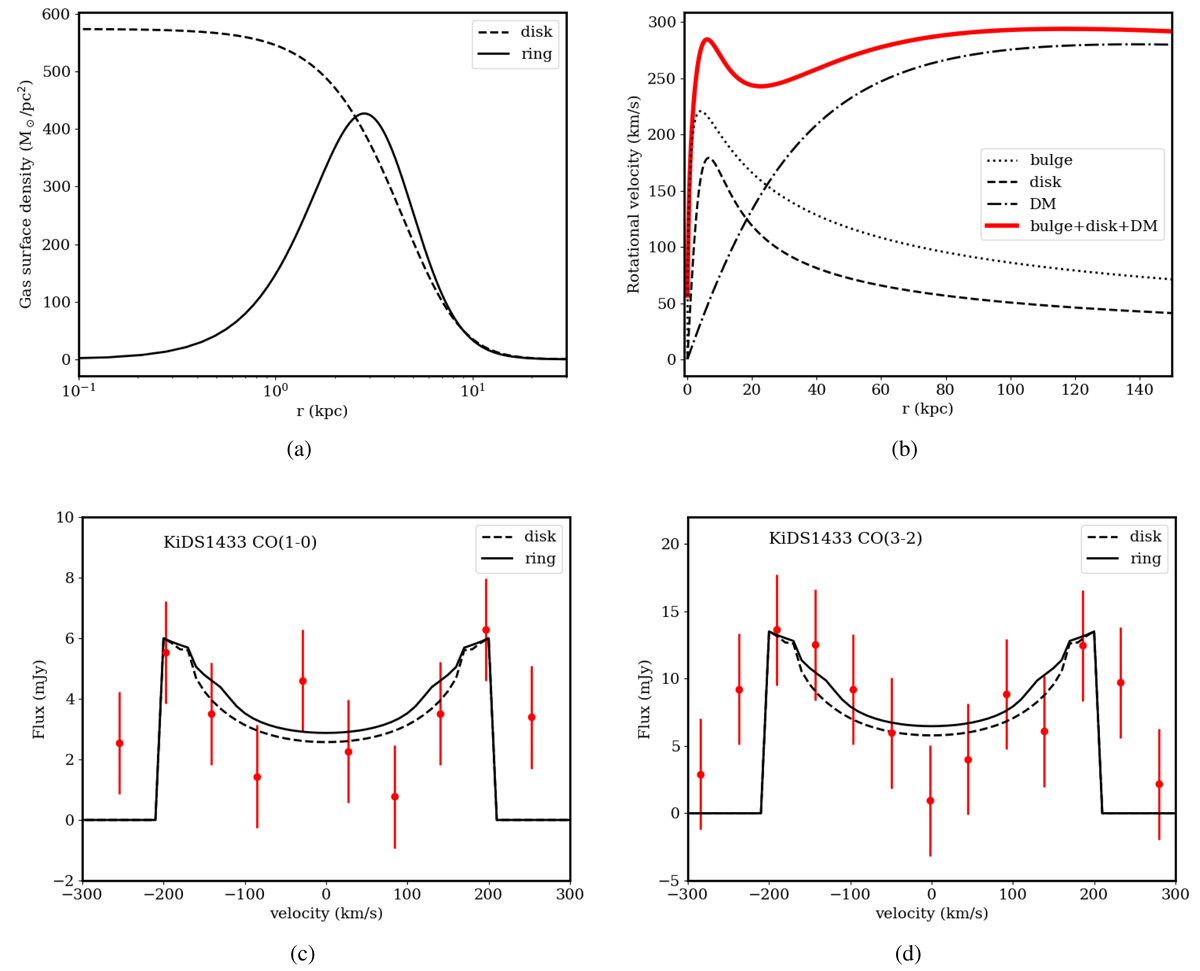
Modeling of the double-horn emission lines for the KiDS 1433. (a) H2 gas density profile. (b) Rotational velocity curve. (c,d) Observed CO(1→0) and CO(3→2) spectra and modeling. Red dots and error bars are the observed fluxes and their uncertainties, respectively. Dashed and solid black lines correspond to the disk and ring models, respectively. See the legend and text for further details.
Current usage metrics show cumulative count of Article Views (full-text article views including HTML views, PDF and ePub downloads, according to the available data) and Abstracts Views on Vision4Press platform.
Data correspond to usage on the plateform after 2015. The current usage metrics is available 48-96 hours after online publication and is updated daily on week days.
Initial download of the metrics may take a while.