Open Access
Fig. 6.
Download original image
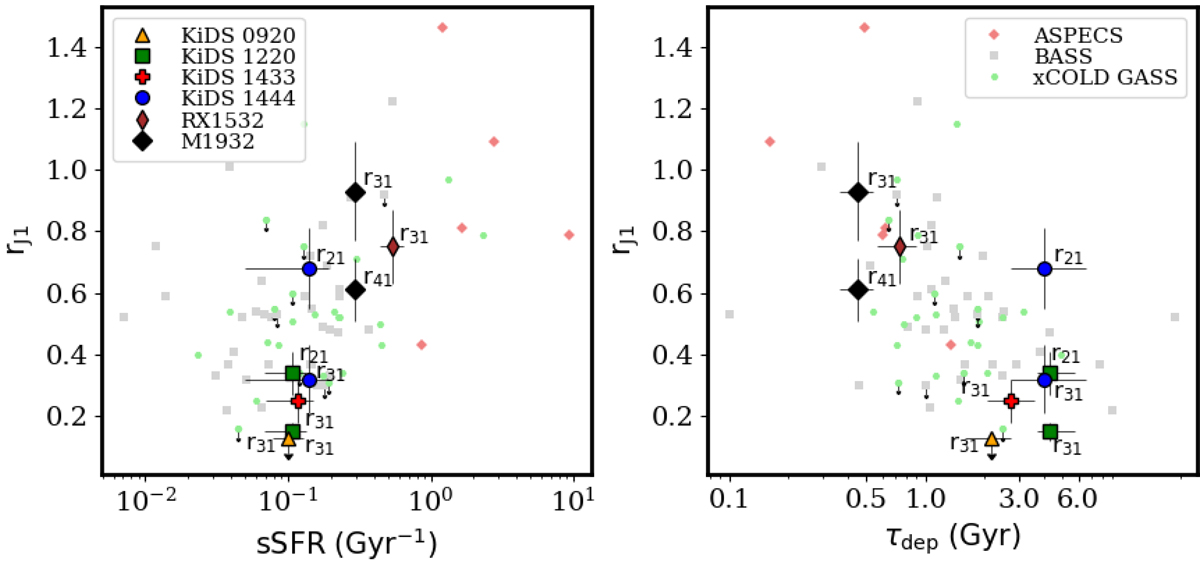
Excitation ratios rJ1 plotted against the sSFR (left) and the depletion time (right) for intermediate-redshift BCGs with multiple CO(J → J − 1) detections. The color-code for the BCGs and the comparison sources (ASPECS, BASS, and XCOLD GASS) is reported at the top of the two panels.
Current usage metrics show cumulative count of Article Views (full-text article views including HTML views, PDF and ePub downloads, according to the available data) and Abstracts Views on Vision4Press platform.
Data correspond to usage on the plateform after 2015. The current usage metrics is available 48-96 hours after online publication and is updated daily on week days.
Initial download of the metrics may take a while.