Fig. 3

Download original image
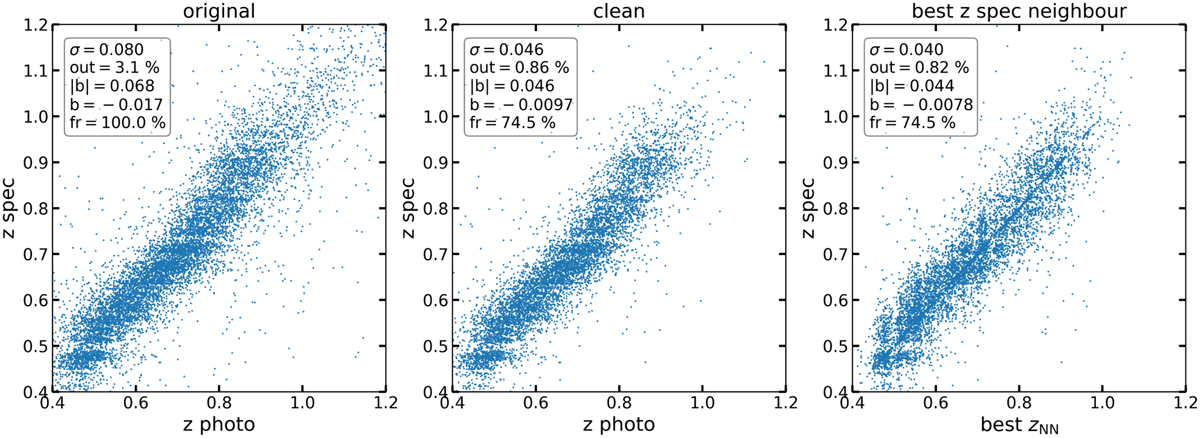
Central galaxy spectroscopic redshift versus its photometric redshift measured with and without NezNet. The left panel shows the distribution of photometric vs. spectroscopic estimates in the original data. In the middle panel, we show the same distribution after removing the galaxies with low score probability from the catalogue (fr stands for the fraction of retained data). Finally, the right panel shows redshift estimates by assigning the spectroscopic redshift of the neighbour with the highest detection probability to the target galaxy. The model was trained with nNN = 30 and Δz = 0.08.
Current usage metrics show cumulative count of Article Views (full-text article views including HTML views, PDF and ePub downloads, according to the available data) and Abstracts Views on Vision4Press platform.
Data correspond to usage on the plateform after 2015. The current usage metrics is available 48-96 hours after online publication and is updated daily on week days.
Initial download of the metrics may take a while.


