Open Access
Fig. 4
Download original image
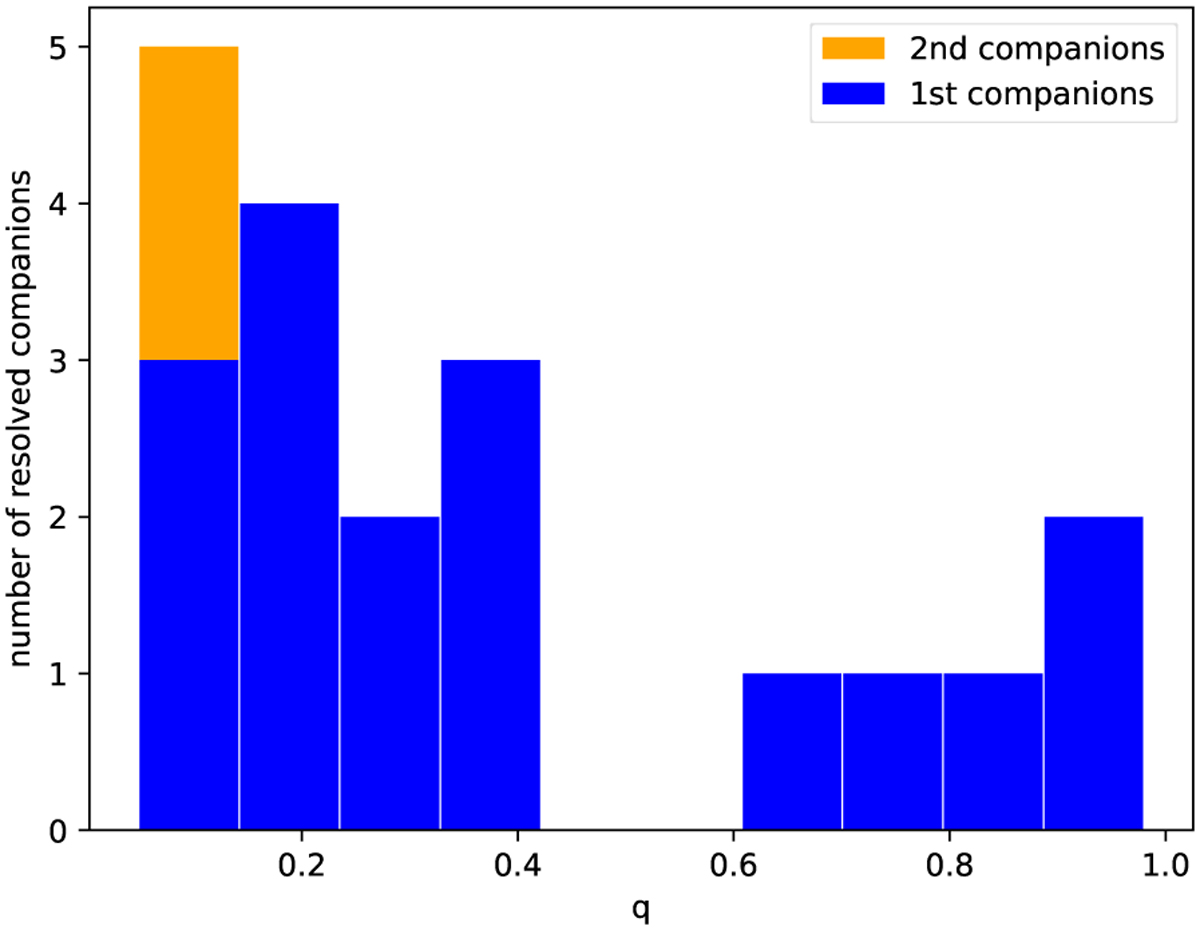
Histogram of detected companions as a function of the estimated mass ratio q, when taking into account only the first detected companions (blue), and when adding the second companions detected (orange).
Current usage metrics show cumulative count of Article Views (full-text article views including HTML views, PDF and ePub downloads, according to the available data) and Abstracts Views on Vision4Press platform.
Data correspond to usage on the plateform after 2015. The current usage metrics is available 48-96 hours after online publication and is updated daily on week days.
Initial download of the metrics may take a while.