Fig. 7
Download original image
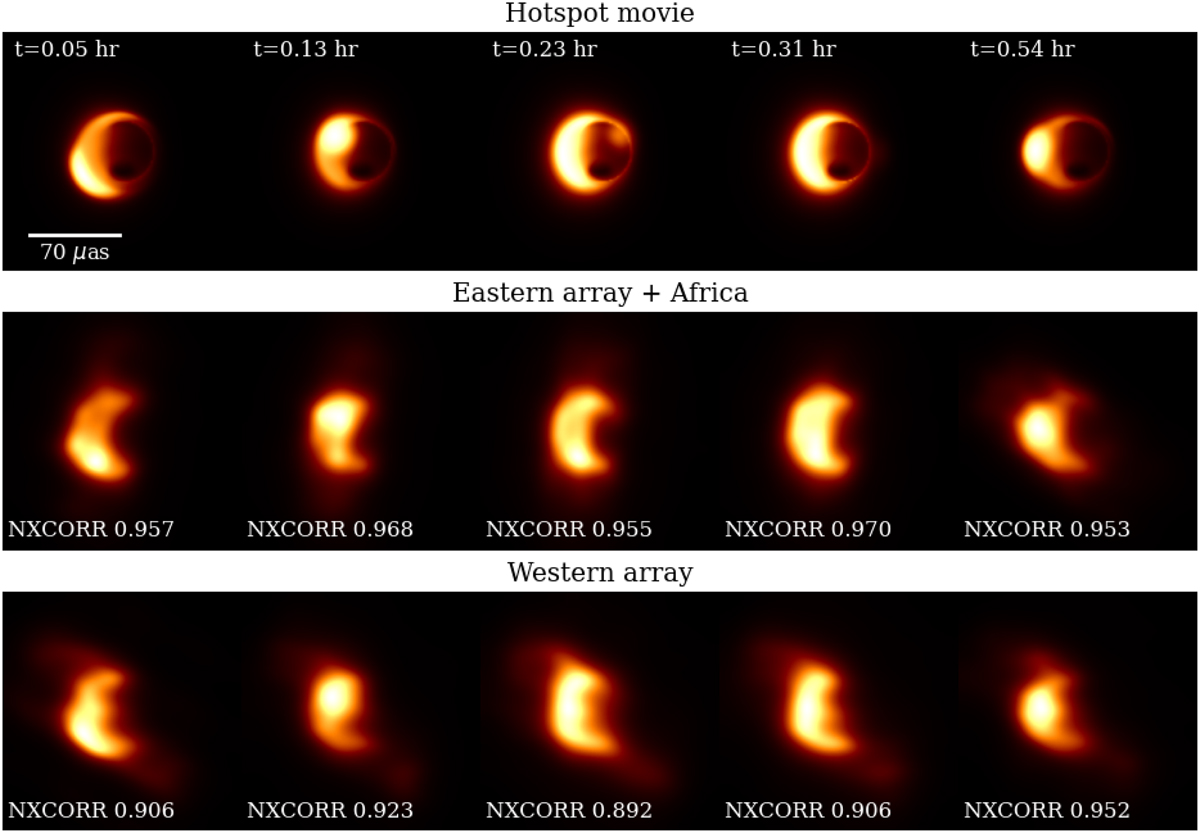
Dynamical reconstructions generated using the hotspot synthetic data. In the first row, we show five snapshots of the hotspot model movie. The hotspot performs a full rotation every 27 min. The frames were chosen to represent a complete orbit. The reconstructions obtained from the dynamical imaging using the Eastern array + Africa and Western array are shown in the second and third row, respectively. The movies were generated in a time window of about 1.7 h (21–22.7 GMST for the Eastern array, 1.5–3.2 GMST for the Western). The NXCORR values estimated for the reconstructions is reported in the bottom of each images. The temporal evolution is available as an online movie.
Current usage metrics show cumulative count of Article Views (full-text article views including HTML views, PDF and ePub downloads, according to the available data) and Abstracts Views on Vision4Press platform.
Data correspond to usage on the plateform after 2015. The current usage metrics is available 48-96 hours after online publication and is updated daily on week days.
Initial download of the metrics may take a while.