Fig. 6
Download original image
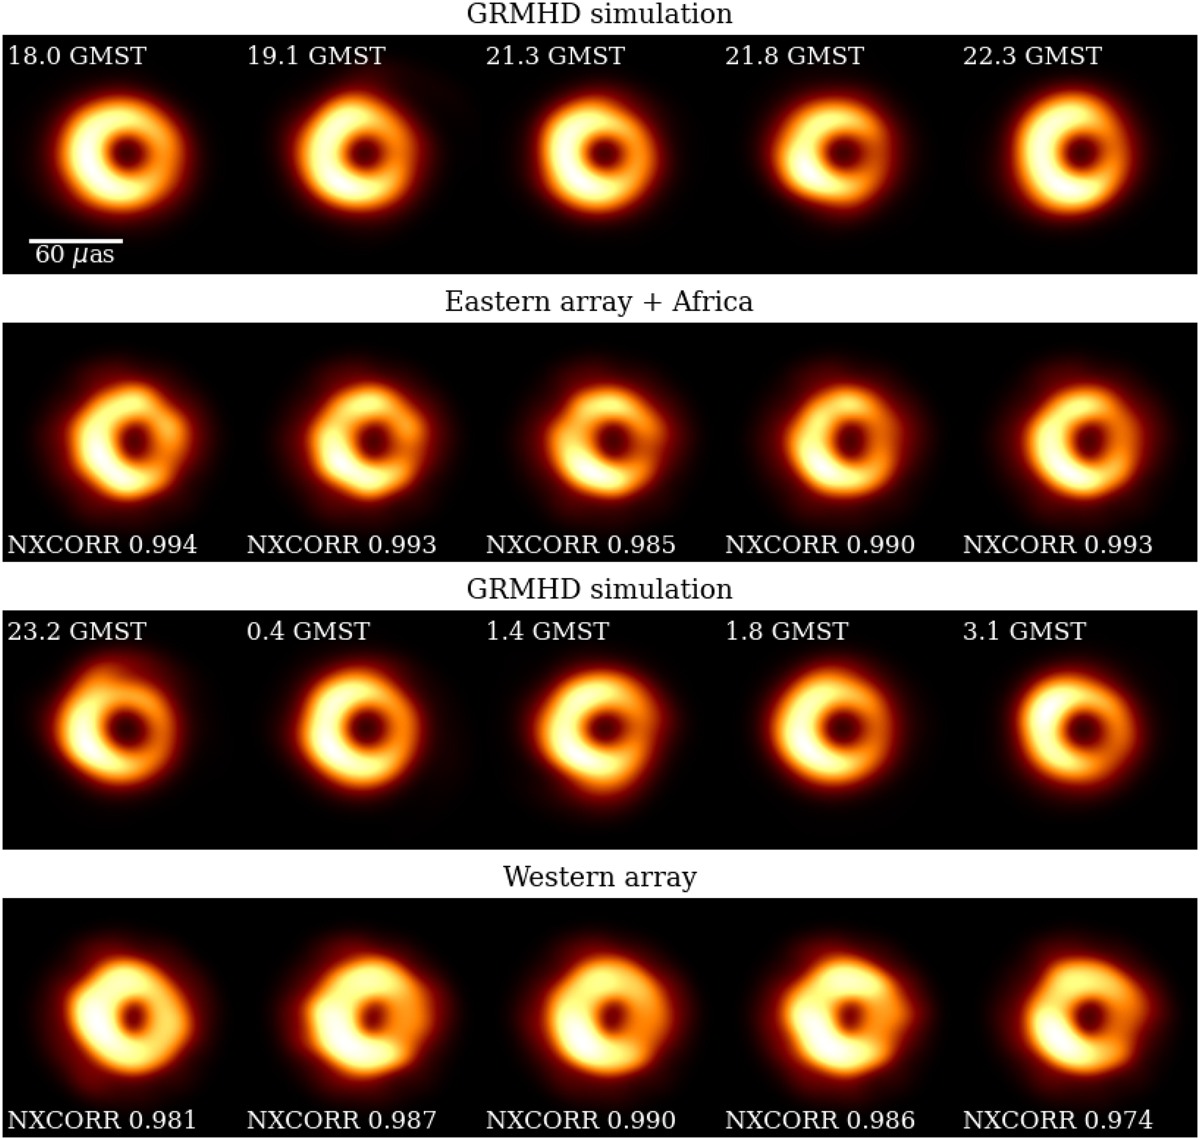
Dynamical reconstructions obtained from the GRMHD data sets. The first row shows five snapshots of the GRMHD simulation taken in the Eastern array (17–22.7 GMST), the second row represents the respective dynamical reconstructions using the Eastern array + Africa. In a similar way, the third row and forth row illustrate the GRMHD frame simulations and the correspondent frame reconstructions using the Western array (22.7–4.1 GMST). The blurring utilized for the GRMHD simulation is 0.6× clean beam. Higher quality dynamical reconstructions are produced by the Eastern array + Africa, also confirmed by the NXCORR metric reported at the bottom of each image. The numbers on the top of the GRMHD simulation snapshots represent the frame time.
Current usage metrics show cumulative count of Article Views (full-text article views including HTML views, PDF and ePub downloads, according to the available data) and Abstracts Views on Vision4Press platform.
Data correspond to usage on the plateform after 2015. The current usage metrics is available 48-96 hours after online publication and is updated daily on week days.
Initial download of the metrics may take a while.