Fig. 2
Download original image
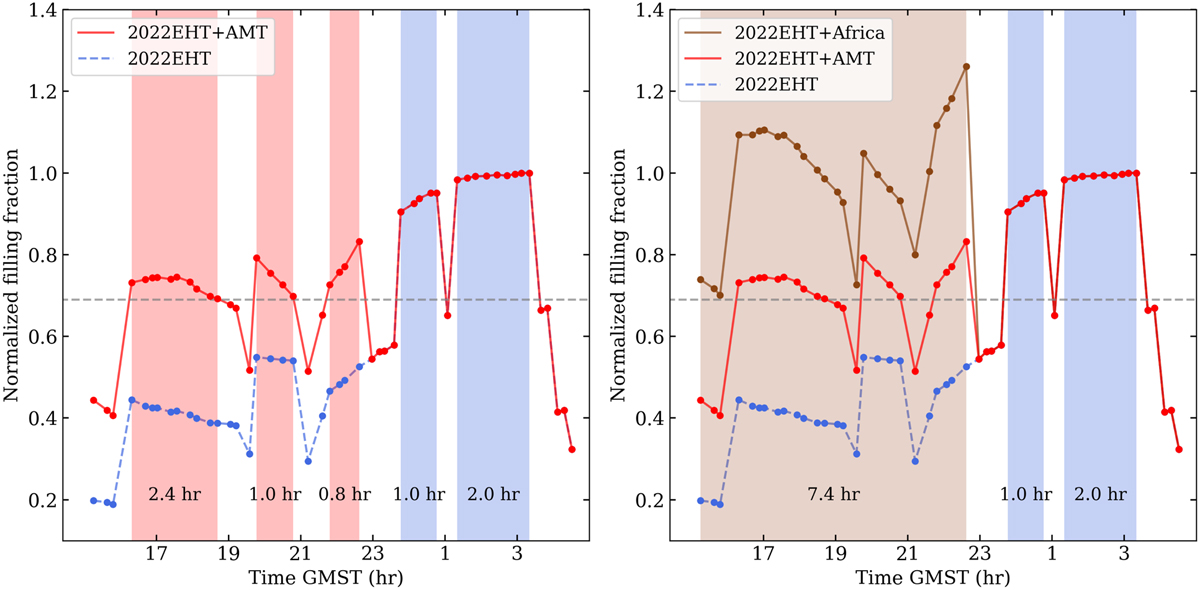
Time-dependent Fourier filling fraction normalized by the maximum Fourier filling of the 2022EHT array. The curves represent the filling fraction of the 2022EHT array, 2022EHT + AMT array and 2022EHT + Africa array, in blue, red and brown, respectively. The dashed gray line corresponds to the lower limit used for identifying good time windows to perform dynamical imaging. The optimal time regions for the current EHT array are shown in blue. The 2022EHT + AMT adds three time windows (red areas) of ~4h in total, while the 2022EHT + Africa array (brown area) produces a time window of ~7.4 h.
Current usage metrics show cumulative count of Article Views (full-text article views including HTML views, PDF and ePub downloads, according to the available data) and Abstracts Views on Vision4Press platform.
Data correspond to usage on the plateform after 2015. The current usage metrics is available 48-96 hours after online publication and is updated daily on week days.
Initial download of the metrics may take a while.