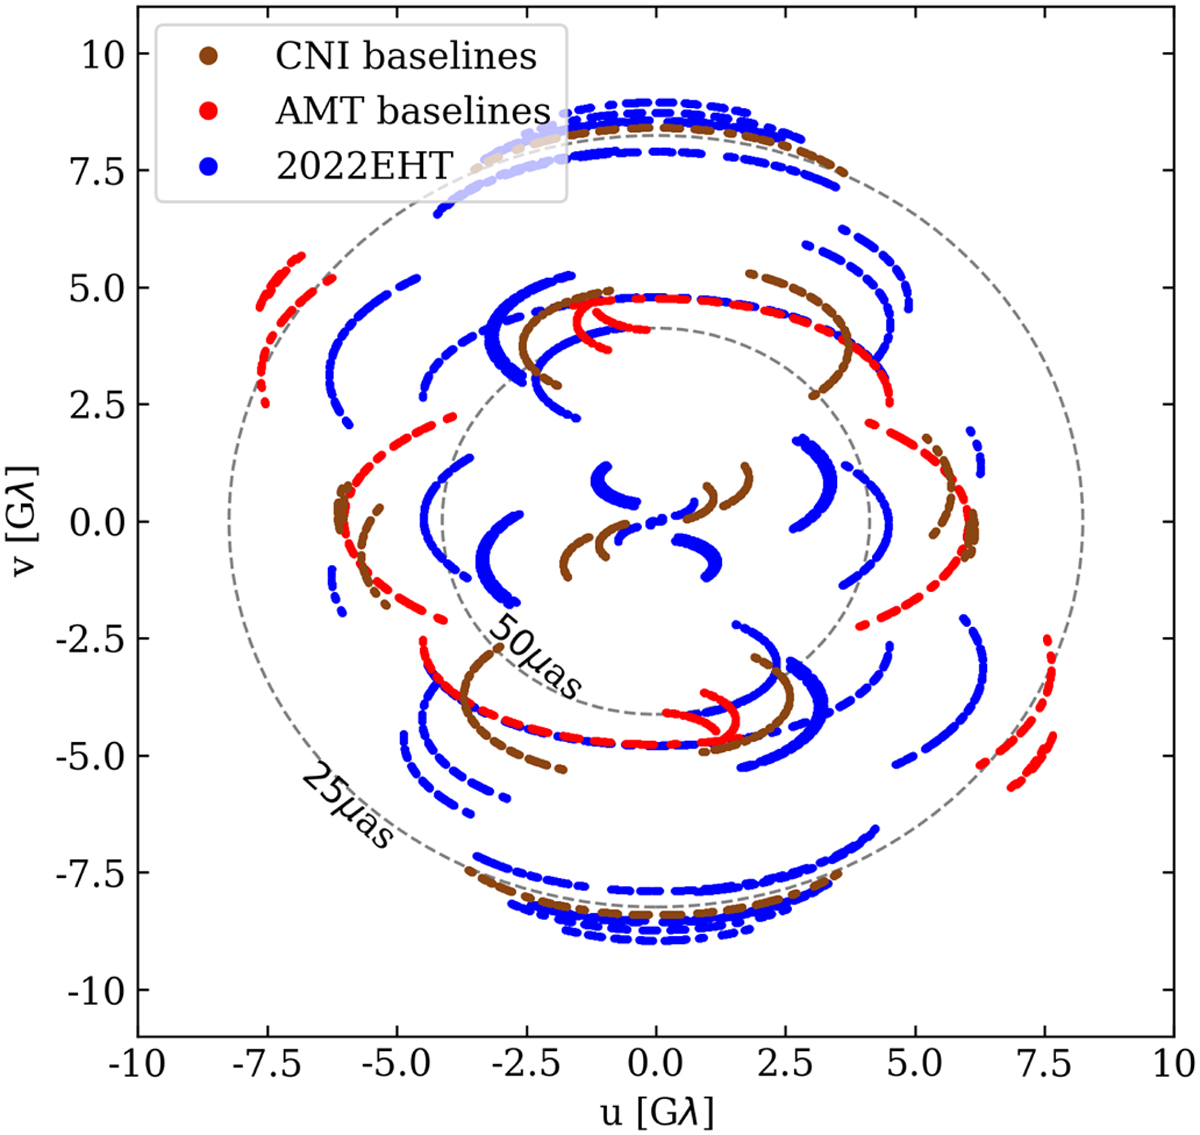
Fig. 1
Download original image
Sgr A* (u, v) coverage of the 2017 April 7 EHT observations. Seven scans on Sgr A* were added to the original schedule at the beginning of the observation, brought by the introduction of the NOEMA array and the African stations. In blue, the coverage obtained with the 2022EHT array. The contributions of the AMT and CNI baselines are shown in red and in brown, respectively. The AMT adds long northeast and southwest baselines increasing the EHT resolution, while CNI offers shorter baselines to detect large-scale emission and constrain the source extent.
Current usage metrics show cumulative count of Article Views (full-text article views including HTML views, PDF and ePub downloads, according to the available data) and Abstracts Views on Vision4Press platform.
Data correspond to usage on the plateform after 2015. The current usage metrics is available 48-96 hours after online publication and is updated daily on week days.
Initial download of the metrics may take a while.