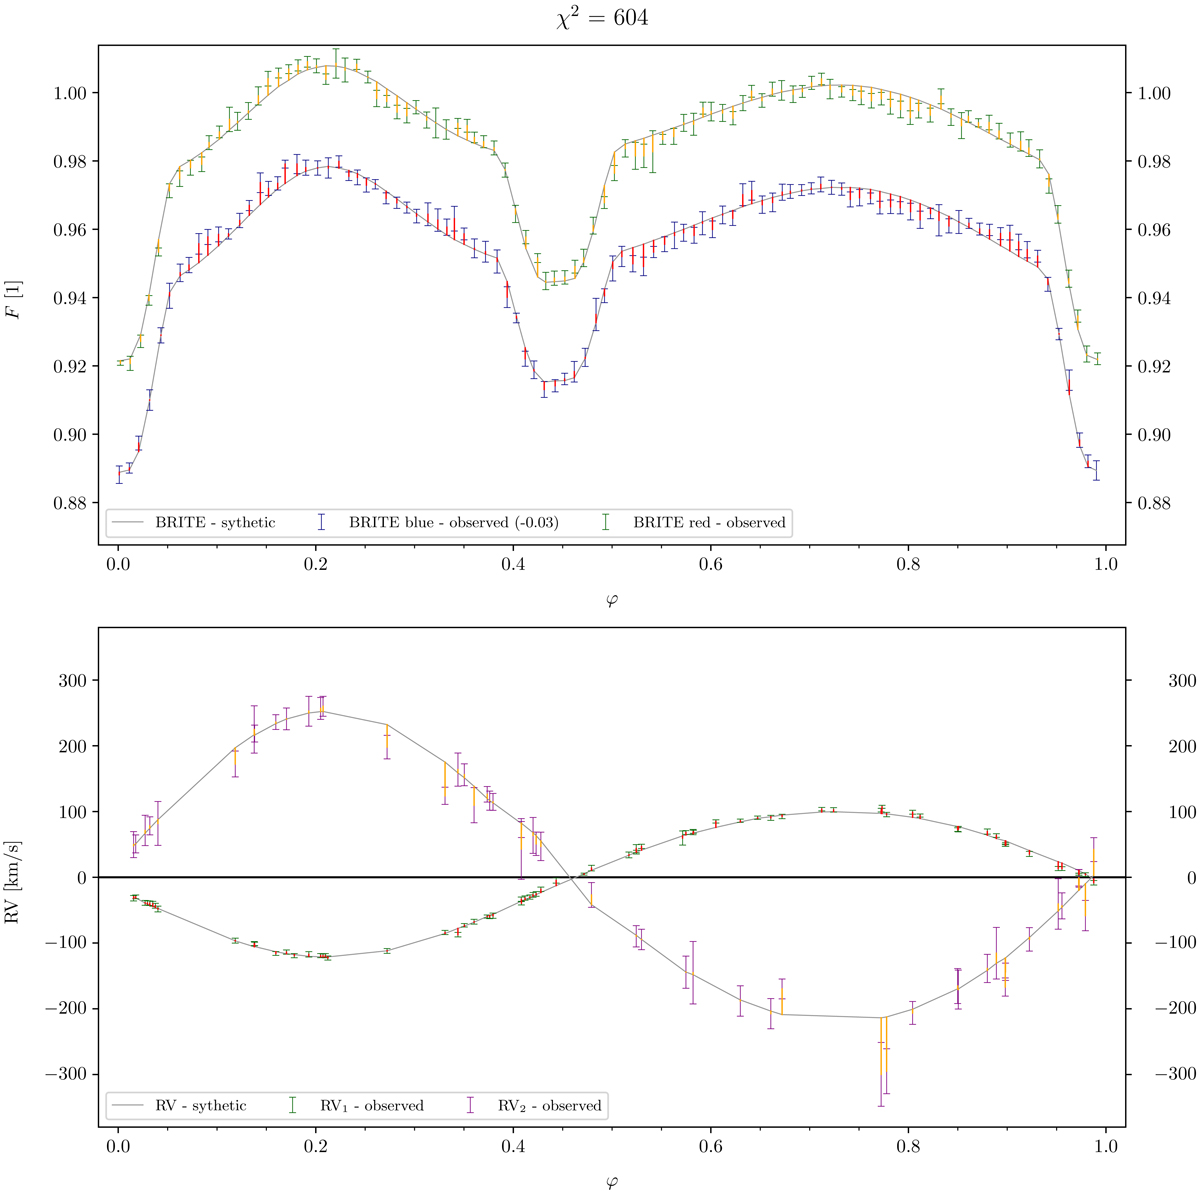
Fig. 9.
Download original image
Comparison of observations and the phoebe2 model of δ Ori with χ2 = 604. The values of the effective temperature of the primary T1 and the third light l3 were fixed. The upper panel shows the phased LCs in the blue and red BRITE filters. The lower panel shows the RV curves for the primary Aa1 (forestgreen greenblack) and the secondary Aa2 (pypurple purpleblack). The grey points correspond to our model, the red lines to the residuals, or contributions to χ2.
Current usage metrics show cumulative count of Article Views (full-text article views including HTML views, PDF and ePub downloads, according to the available data) and Abstracts Views on Vision4Press platform.
Data correspond to usage on the plateform after 2015. The current usage metrics is available 48-96 hours after online publication and is updated daily on week days.
Initial download of the metrics may take a while.