Fig. 8.
Download original image
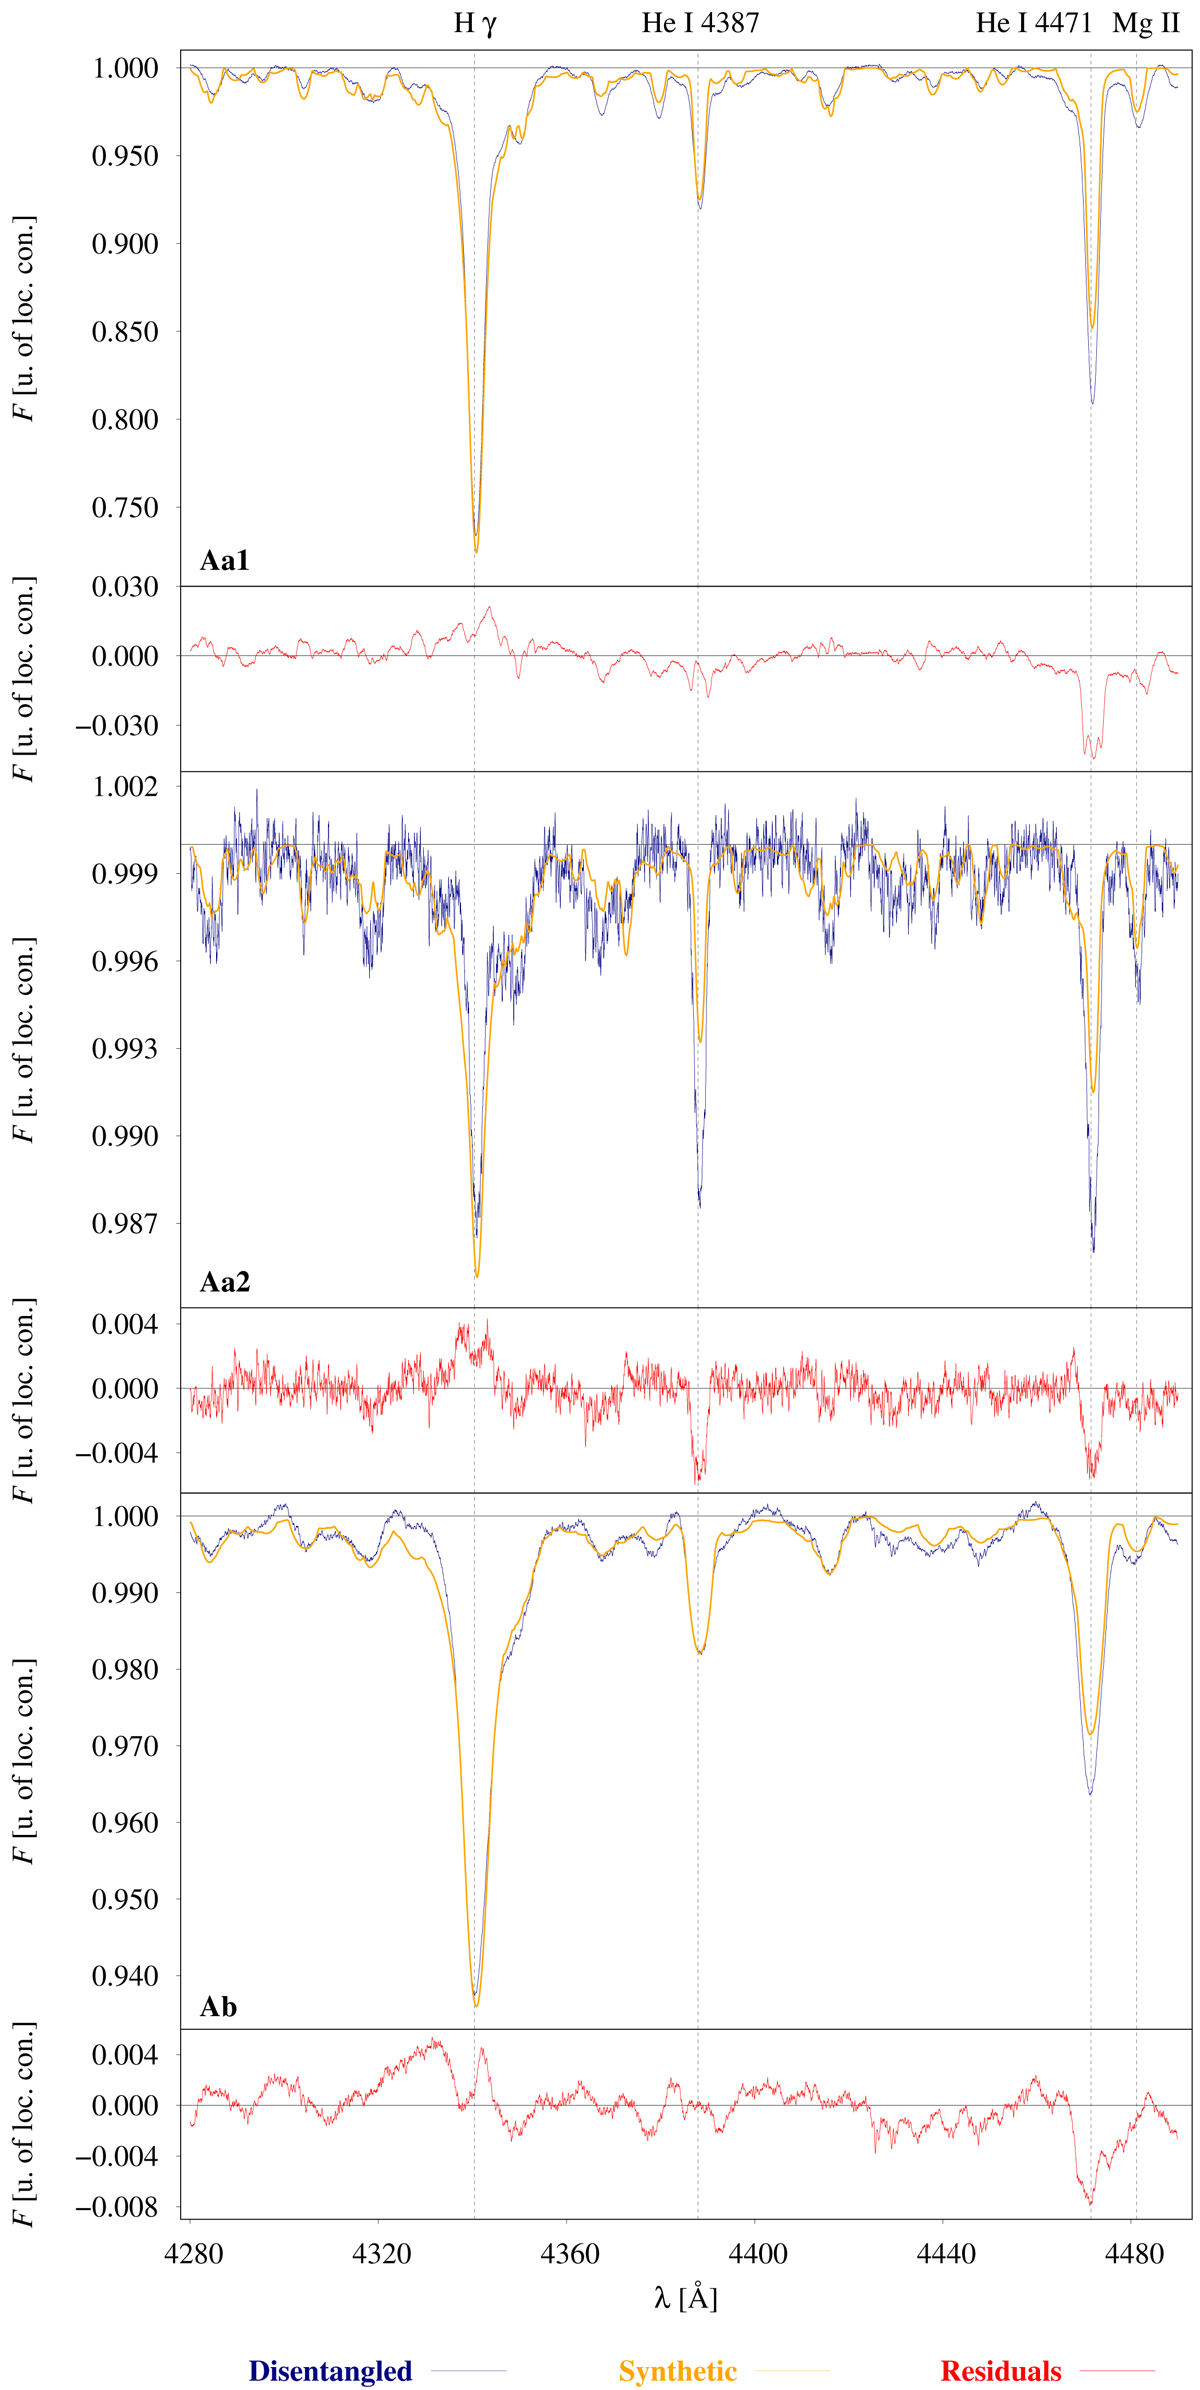
Comparison of the disentangled spectra (blue) of the Aa1, Aa2, and Ab components with the best-fit synthetic spectra (orange) found by PYTERPOL. The range from 428 to 449 nm was used for disentangling. The flux is normalised to the local continuum. The small panels show the residuals (red). The relative luminosities of the Aa1 and Ab components significantly exceed that of the Aa2 component (see also Table 7).
Current usage metrics show cumulative count of Article Views (full-text article views including HTML views, PDF and ePub downloads, according to the available data) and Abstracts Views on Vision4Press platform.
Data correspond to usage on the plateform after 2015. The current usage metrics is available 48-96 hours after online publication and is updated daily on week days.
Initial download of the metrics may take a while.