Open Access
Fig. 6.
Download original image
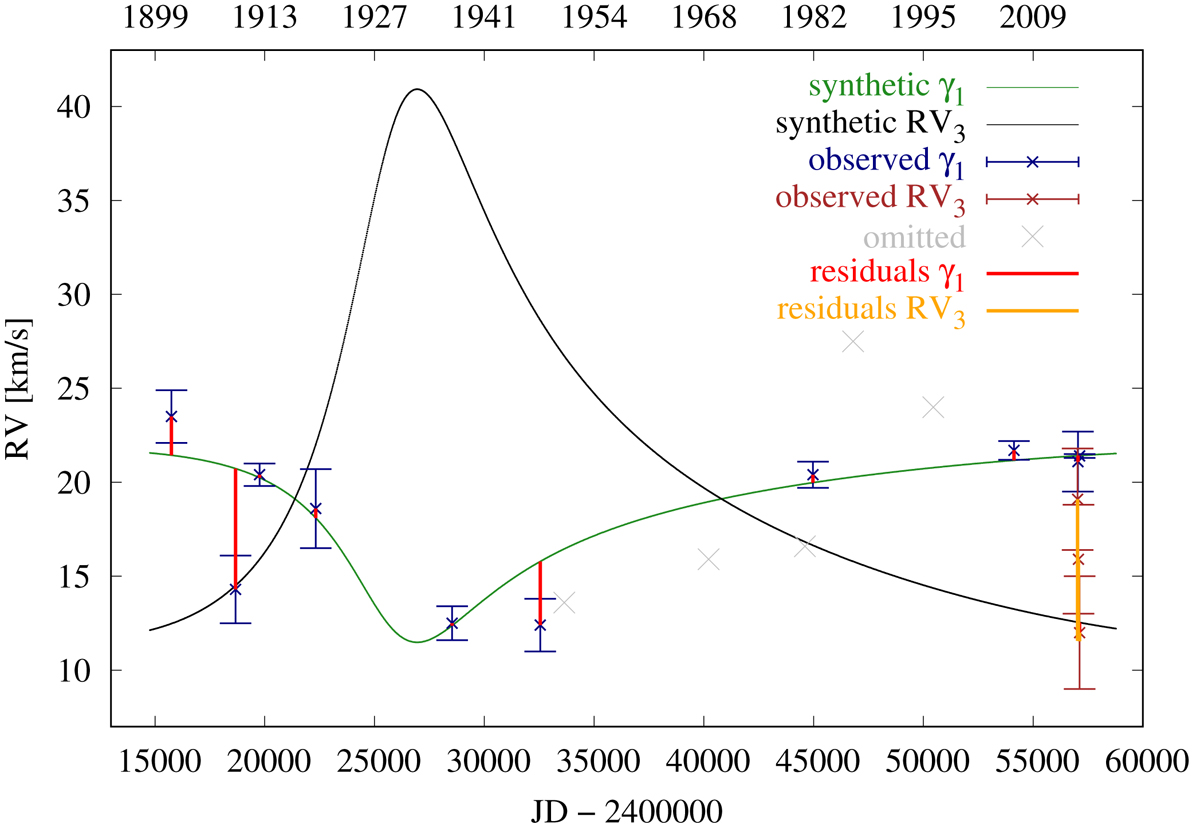
Synthetic RVs of the Aa1+Aa2 (green) and Ab (black) components, relative to the barycentre of the (Aa1+Aa2)+Ab system. We used a simplified two-body model and fitted data from Table 5, plotted with blue symbols. The residuals are plotted in red; the value of χ2 = 95. The last most precise point is from this work.
Current usage metrics show cumulative count of Article Views (full-text article views including HTML views, PDF and ePub downloads, according to the available data) and Abstracts Views on Vision4Press platform.
Data correspond to usage on the plateform after 2015. The current usage metrics is available 48-96 hours after online publication and is updated daily on week days.
Initial download of the metrics may take a while.