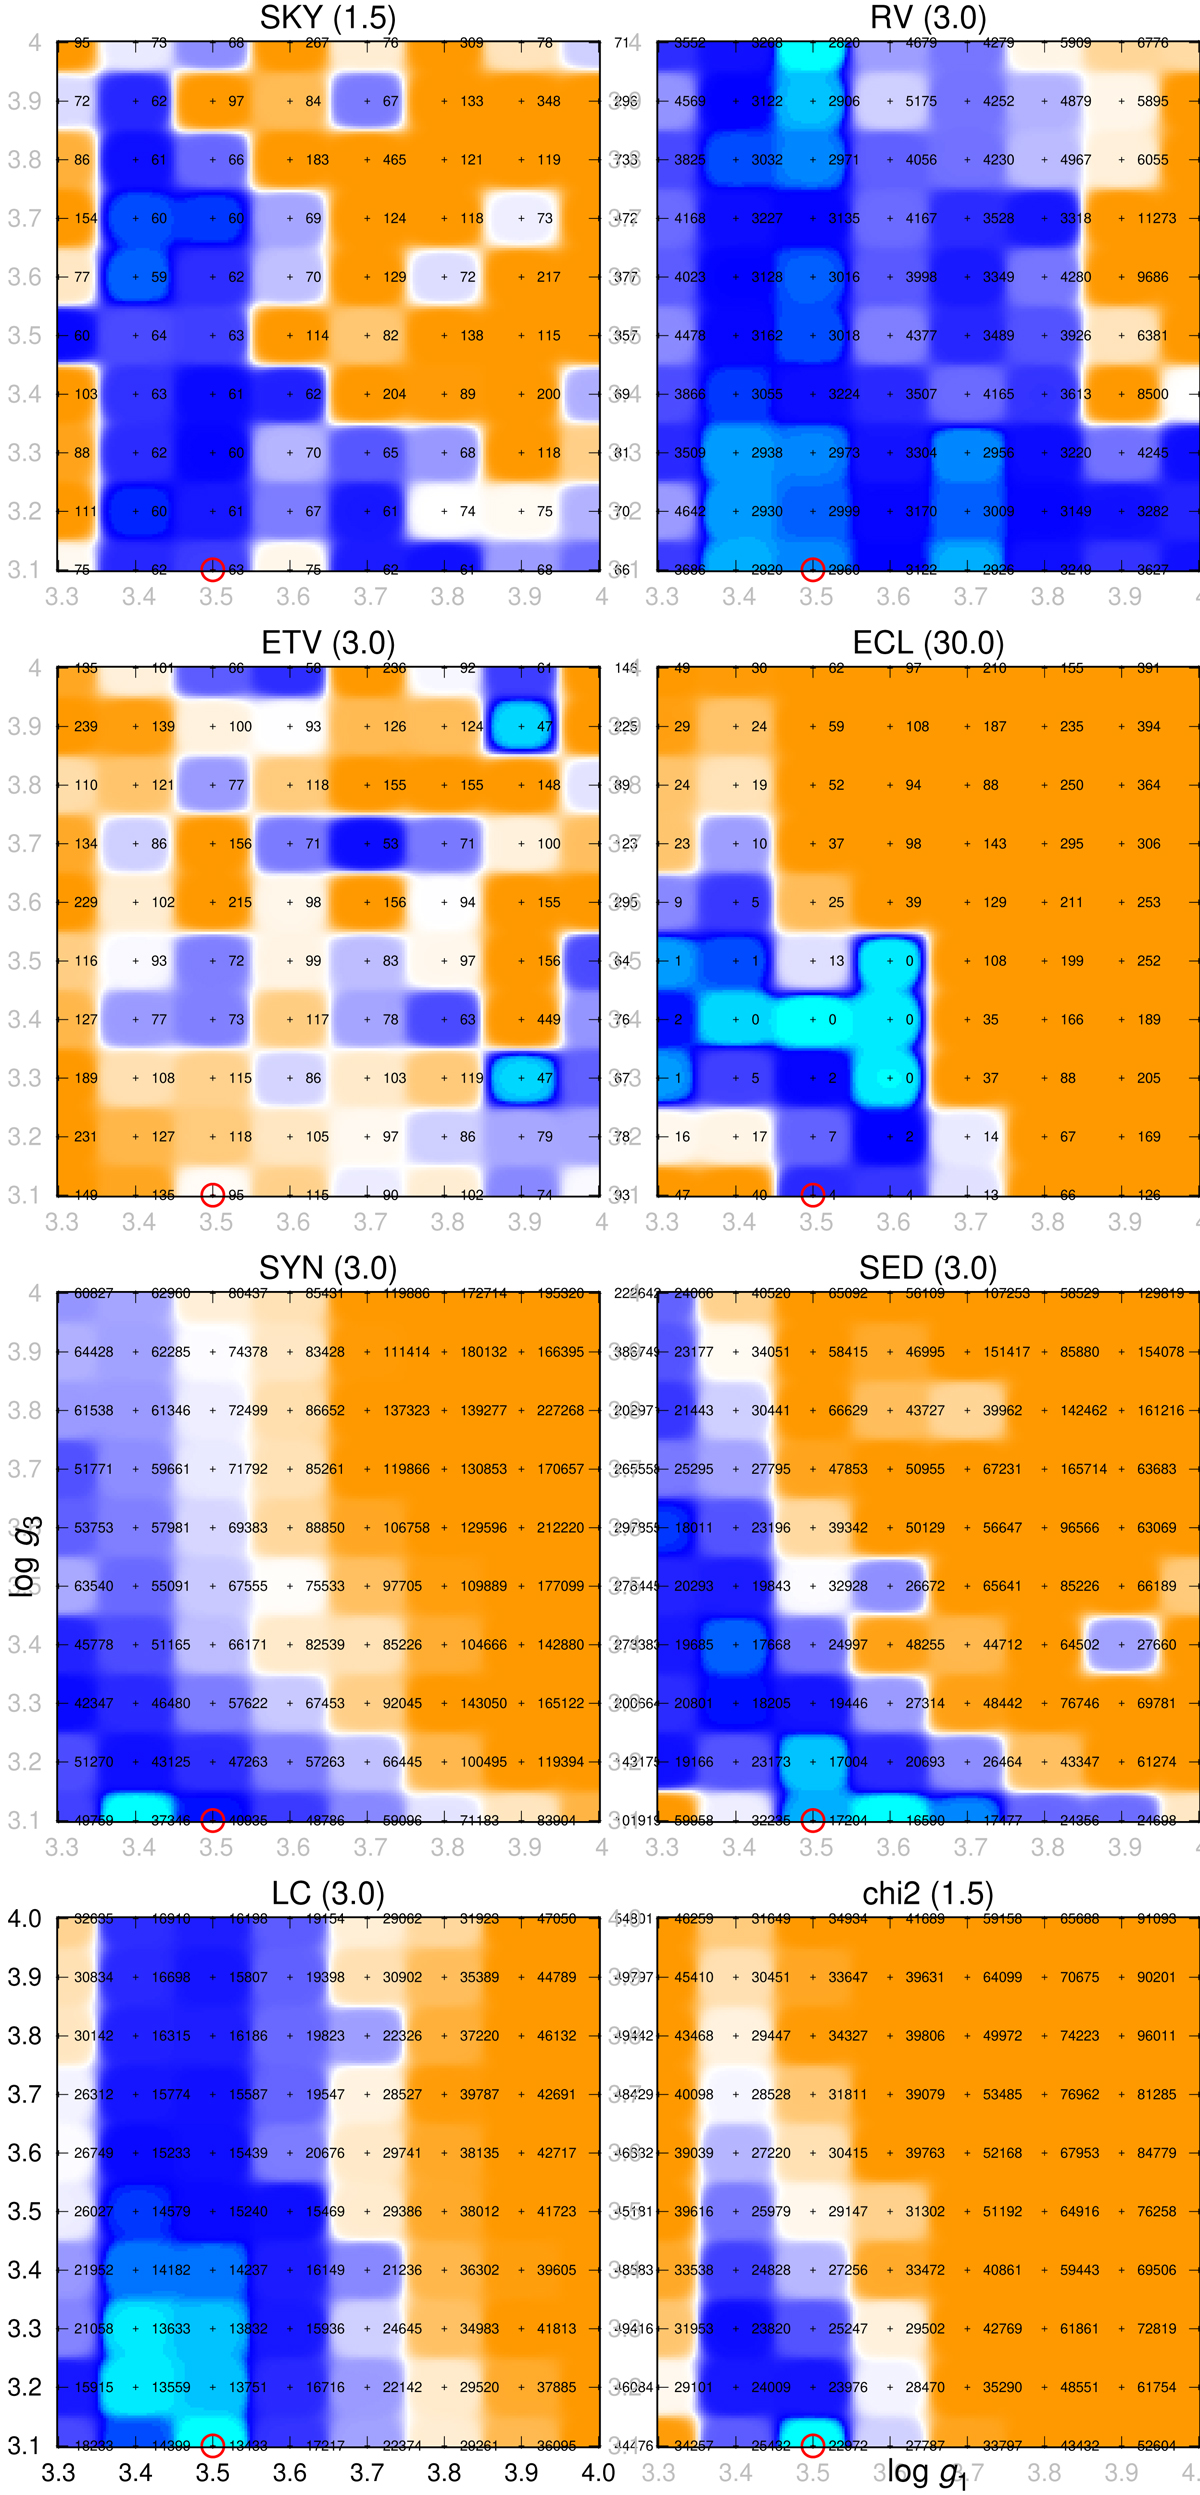
Fig. B.2.
Download original image
Contributions to χ2 for a set 100 best-fit models of δ Ori. Individual contributions are shown in the panels (from top left): astrometry (SKY), RV, eclipse timings (ETV), eclipse duration (ECL), normalised spectra (SYN), SED, light curve (LC), and total. Every simplex was initialised with a different combination of the gravitational accelerations log g1, log g3, which were kept fixed to obtain a regular grid. All other parameters were free. The number of convergence steps was limited to 2000, consequently, 200000 models were computed in total. Axes correspond to the values of log g1, log g3, colours to χ2 (see also tiny numbers). The colour scale was adjusted as follows: cyan the very best fit for a given data set, blue acceptable fits (< 3.0 min χ2), orange poor fits (≥3.0 min χ2). The factor was 1.5 for the SKY, total; and 30.0 for the ECL data set. ‘Forbidden regions’ can be seen, in particular, large log g1, log g3 due to the SYN, SED, or large log g1 due to the ECL, LC. The weighted very best fit is denoted by the red circle.
Current usage metrics show cumulative count of Article Views (full-text article views including HTML views, PDF and ePub downloads, according to the available data) and Abstracts Views on Vision4Press platform.
Data correspond to usage on the plateform after 2015. The current usage metrics is available 48-96 hours after online publication and is updated daily on week days.
Initial download of the metrics may take a while.