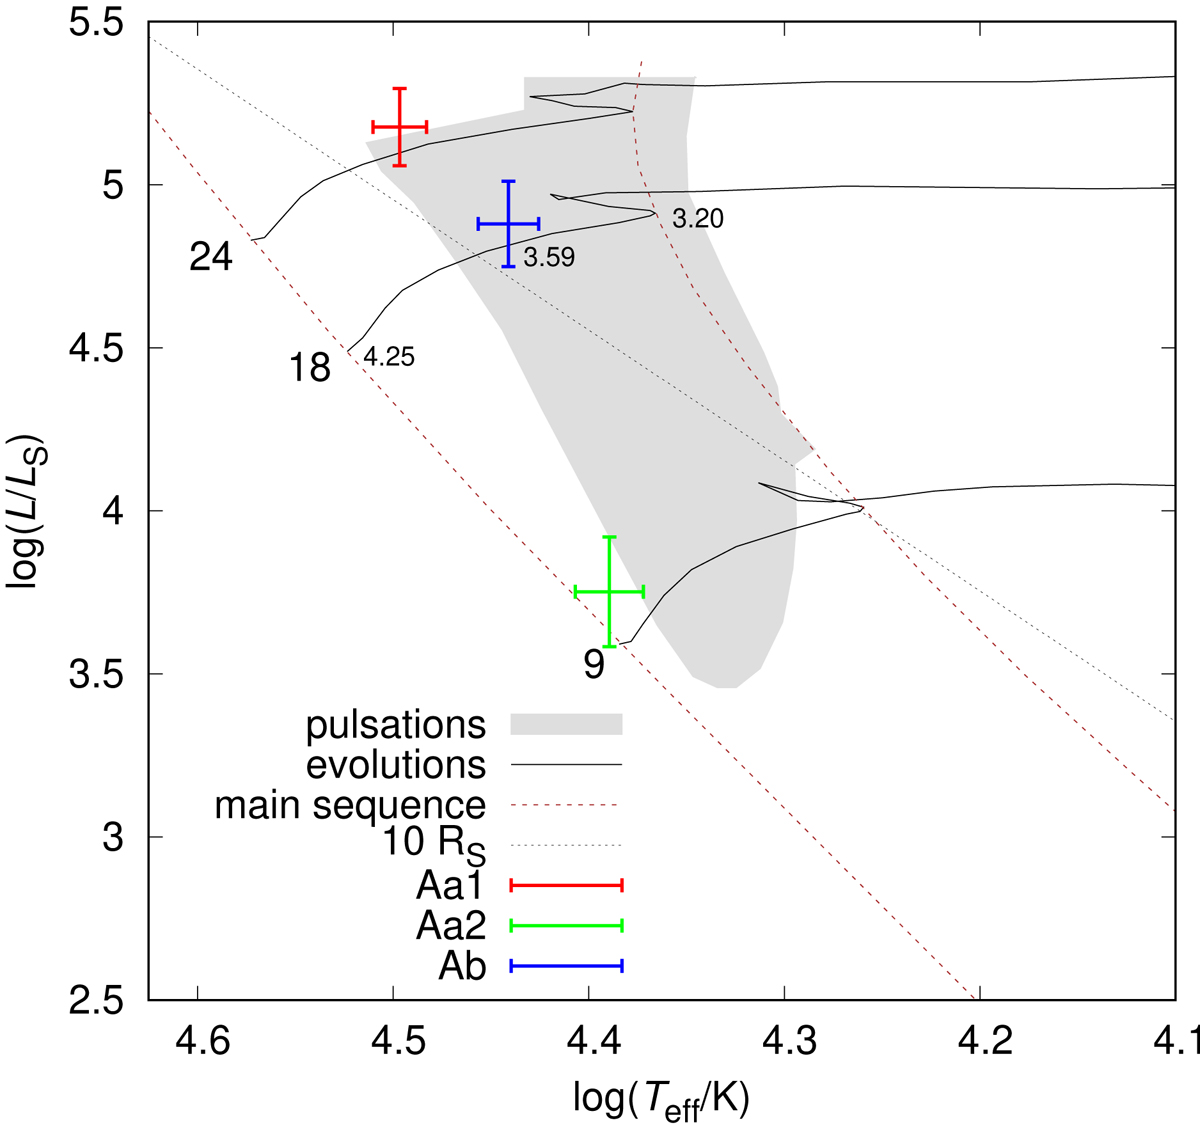
Fig. 20.
Download original image
Hertzsprung–Russel diagram with the positions of the Aa1, Aa2, and Ab components of δ Ori and evolutionary tracks from Paxton et al. (2015). Numbers next to the main sequence indicate the theoretical masses, small numbers the theoretical gravitational acceleration log g. According to the 3-body model, the masses are 17.1, 8.5, 8.7 M⊙. For the tertiary (Ab), it is in disagreement with the evolutionary track, but in agreement with the value of log g3 inferred from normalised spectra (Hγ). The instability region of pulsations (β Cep type, order ℓ = 0) is indicated as grey area. Other modes (ℓ = 1, 2, 3) can be found in a very similar region (Paxton et al. 2015). Both Aa1, Ab components are located here, and they can exhibit photometric variability attributed to pulsations.
Current usage metrics show cumulative count of Article Views (full-text article views including HTML views, PDF and ePub downloads, according to the available data) and Abstracts Views on Vision4Press platform.
Data correspond to usage on the plateform after 2015. The current usage metrics is available 48-96 hours after online publication and is updated daily on week days.
Initial download of the metrics may take a while.