Open Access
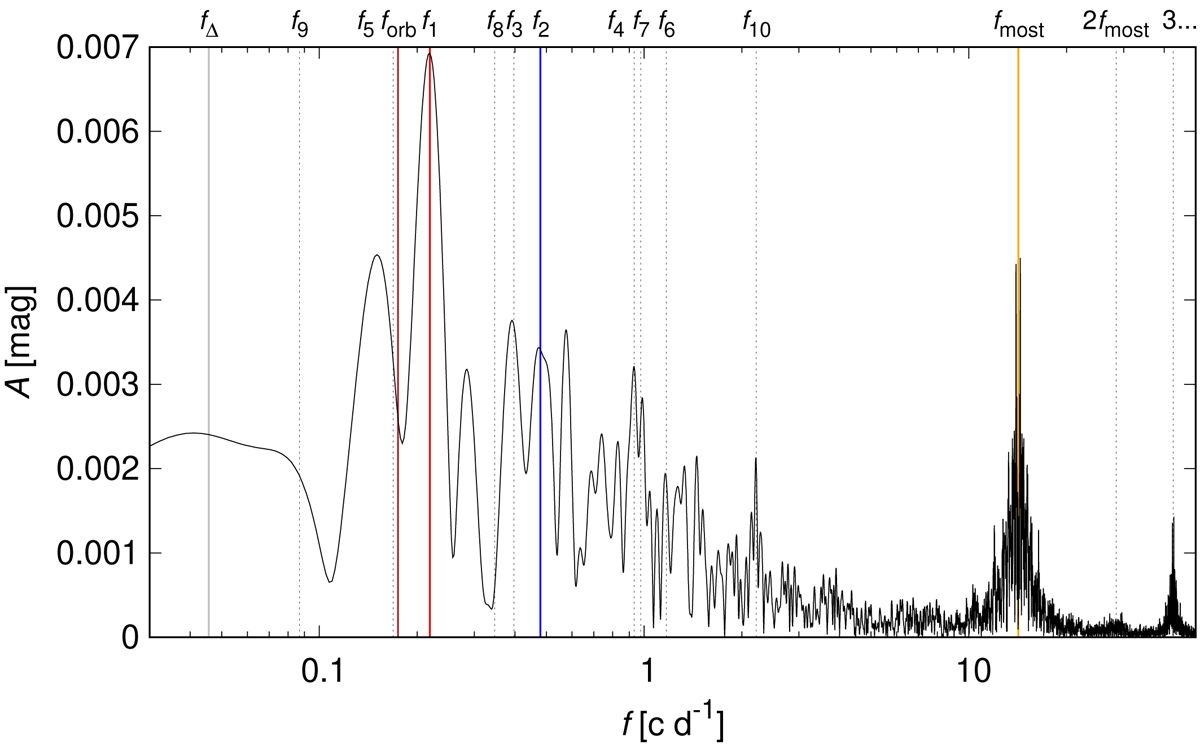
Fig. 19.
Download original image
Periodogram of the residual MOST LC with the 10 principal frequencies indicated on top. The first periodogram is shown; it is subsequently modified by subtraction (prewhitening). The broad peak between 10 to 20 c d−1 corresponds to the satellite frequency fmost and its combinations with f1, etc.
Current usage metrics show cumulative count of Article Views (full-text article views including HTML views, PDF and ePub downloads, according to the available data) and Abstracts Views on Vision4Press platform.
Data correspond to usage on the plateform after 2015. The current usage metrics is available 48-96 hours after online publication and is updated daily on week days.
Initial download of the metrics may take a while.