Fig. 14.
Download original image
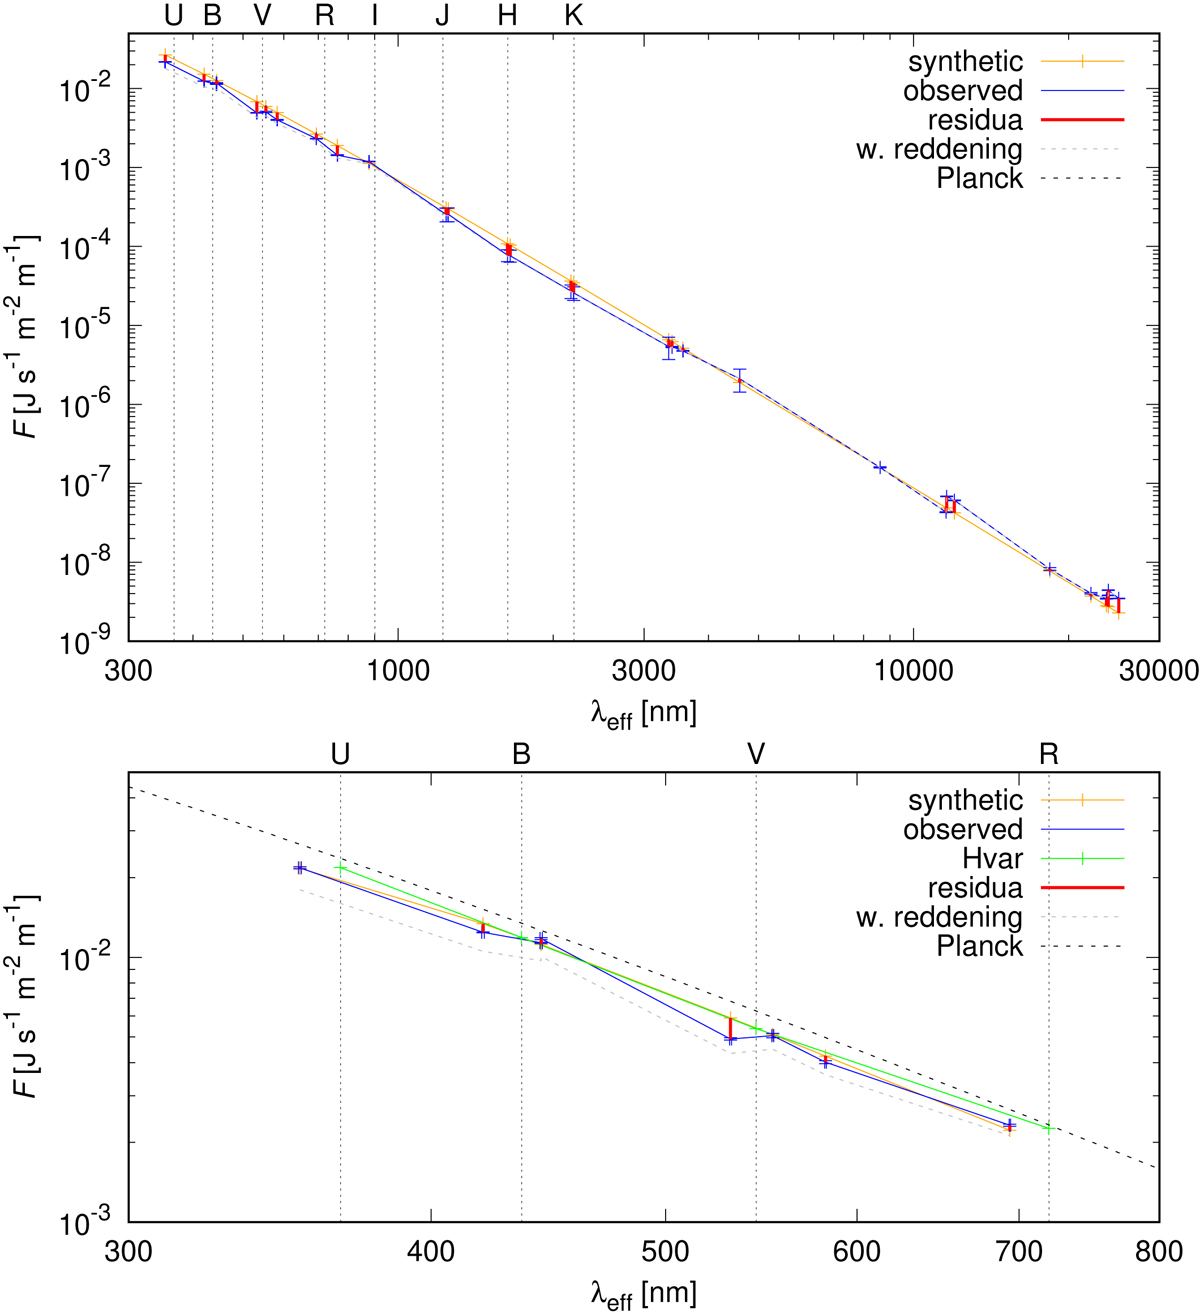
Model from SED data. Top: comparison of the observed (blue) and synthetic (orange) SED of δ Ori. The residuals are plotted in redredblack. The wavelength range is from 350 nm (ultraviolet) to 25 μm (far-infrared). Bottom: the same for the limited wavelength range of synthetic spectra. The Hvar differential UBVR photometry with removed eclipses is plotted in green.
Current usage metrics show cumulative count of Article Views (full-text article views including HTML views, PDF and ePub downloads, according to the available data) and Abstracts Views on Vision4Press platform.
Data correspond to usage on the plateform after 2015. The current usage metrics is available 48-96 hours after online publication and is updated daily on week days.
Initial download of the metrics may take a while.