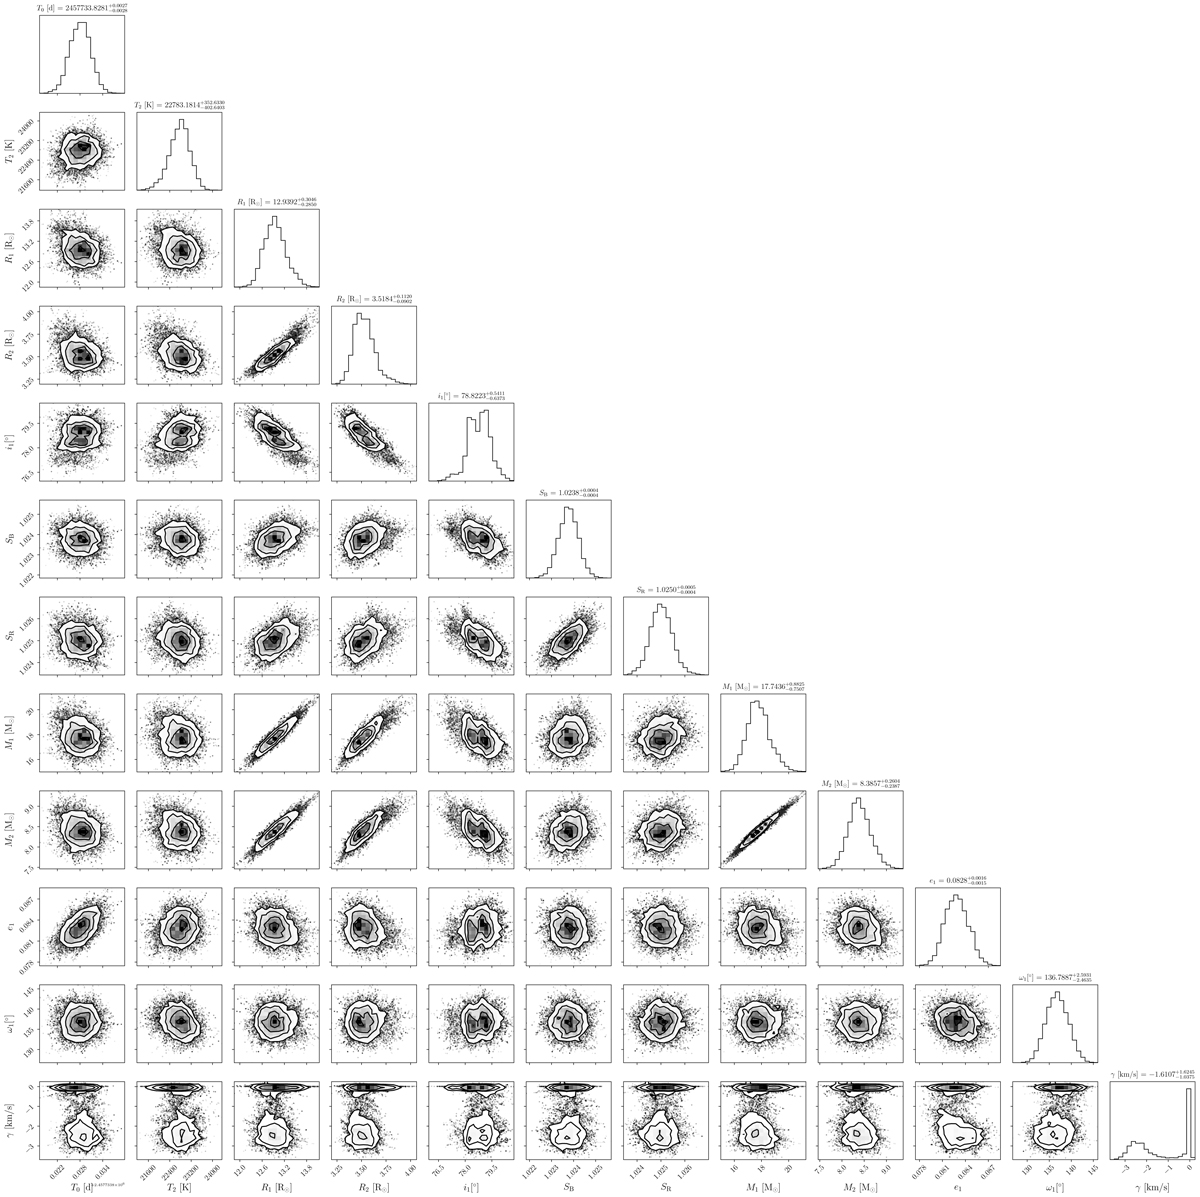
Fig. 10.
Download original image
Corner plot (a full covariance matrix) for the δ Ori model, as derived by the MCMC analysis. The model is the same as in Fig. 9. Each diagonal panel shows a 1D histogram (posterior distribution) for one parameter (explained in Table 9). Each sub-diagonal panel shows a 2D histogram, the isolines corresponding to the confidence intervals, and the correlations between parameters.
Current usage metrics show cumulative count of Article Views (full-text article views including HTML views, PDF and ePub downloads, according to the available data) and Abstracts Views on Vision4Press platform.
Data correspond to usage on the plateform after 2015. The current usage metrics is available 48-96 hours after online publication and is updated daily on week days.
Initial download of the metrics may take a while.