Fig. 8
Download original image
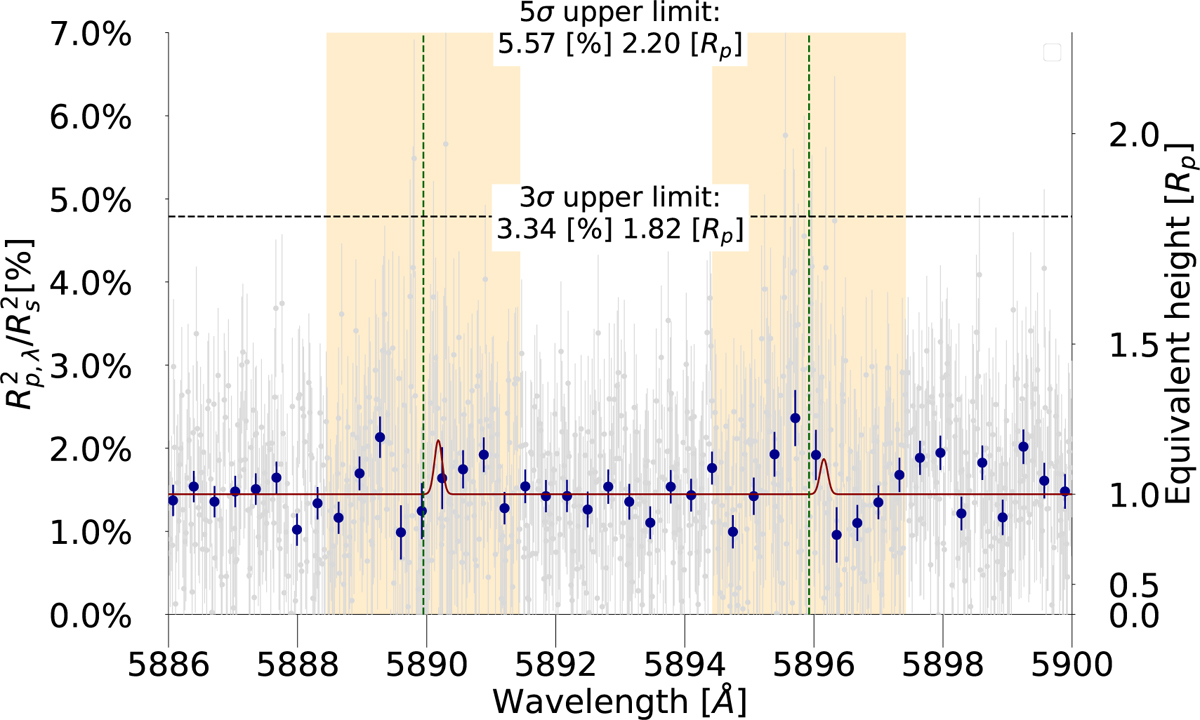
Transmission spectroscopy of KELT-10 b in the region of the sodium doublet. In gray, the entire transmission spectrum is shown (corrected for RM effect, as described in Sect. 5.2), with 20x bins in dark blue. The detection of McCloat et al. (2021) is overplotted (dark red) as a visual cue for comparison. The black dashed line corresponds to the 3σ and 5σ limit above the continuum ![]() . The yellow area is the ±1.5 Å region around each of the Na I lines.
. The yellow area is the ±1.5 Å region around each of the Na I lines.
Current usage metrics show cumulative count of Article Views (full-text article views including HTML views, PDF and ePub downloads, according to the available data) and Abstracts Views on Vision4Press platform.
Data correspond to usage on the plateform after 2015. The current usage metrics is available 48-96 hours after online publication and is updated daily on week days.
Initial download of the metrics may take a while.