Fig. 7

Download original image
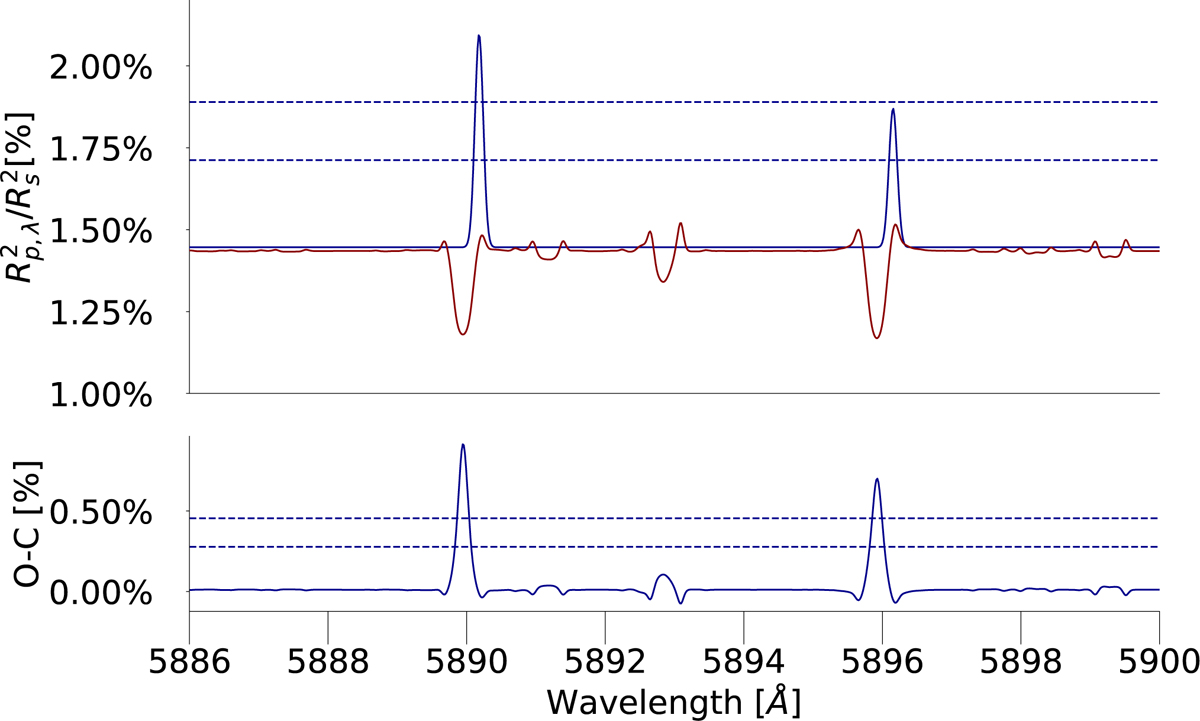
Modeling of the RM + CLV effect on the transmission spectrum in the rest frame of the planet, specifically focused on the sodium detection presented in McCloat et al. (2021, AD2 = 0.66%, σD2 = 0.06 Å, ΔλD2 = +0.23 Å; AD1 = 0.43%, and σD1 = 0.06 Å, ΔλD1 = +0.23 Å). Top panel: Gaussian fit to the lines attributed by McCloat et al. (2021) to planetary sodium (their Fig. 4, blue) and simulated RM and CLV effects using EVE (red). We note that compared to McCloat et al. (2021), we use a reversed y-axis (due to different units used), that is absorption is above continuum and emission is below it. The 3σ and 5σ level reported by McCloat et al. (2021) is shown as dark blue dashed lines. Bottom panel: O–C values (UVES–EVE simulation, blue), and 3σ and 5σ UVES detection levels (blue).
Current usage metrics show cumulative count of Article Views (full-text article views including HTML views, PDF and ePub downloads, according to the available data) and Abstracts Views on Vision4Press platform.
Data correspond to usage on the plateform after 2015. The current usage metrics is available 48-96 hours after online publication and is updated daily on week days.
Initial download of the metrics may take a while.


