Fig. 3
Download original image
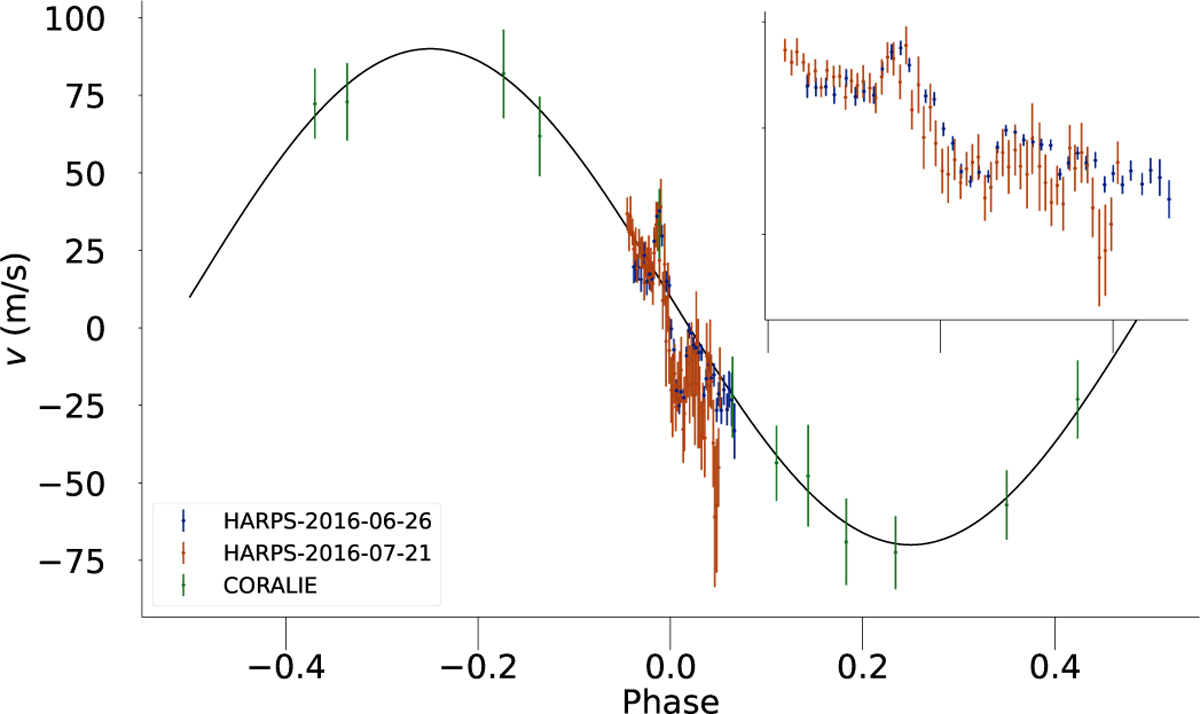
RV observations from CORALIE (green) and HARPS (blue and orange for nights 1 and 2, respectively, analyzed dataset). The black line is a Keplerian model as reported in Kuhn et al. (2016). The inset plot in the upper right corner zooms in on the transit in detail. A strong and roughly symmetrical velocity anomaly due to the RM effect is observed during transit.
Current usage metrics show cumulative count of Article Views (full-text article views including HTML views, PDF and ePub downloads, according to the available data) and Abstracts Views on Vision4Press platform.
Data correspond to usage on the plateform after 2015. The current usage metrics is available 48-96 hours after online publication and is updated daily on week days.
Initial download of the metrics may take a while.