Fig. D.1
Download original image
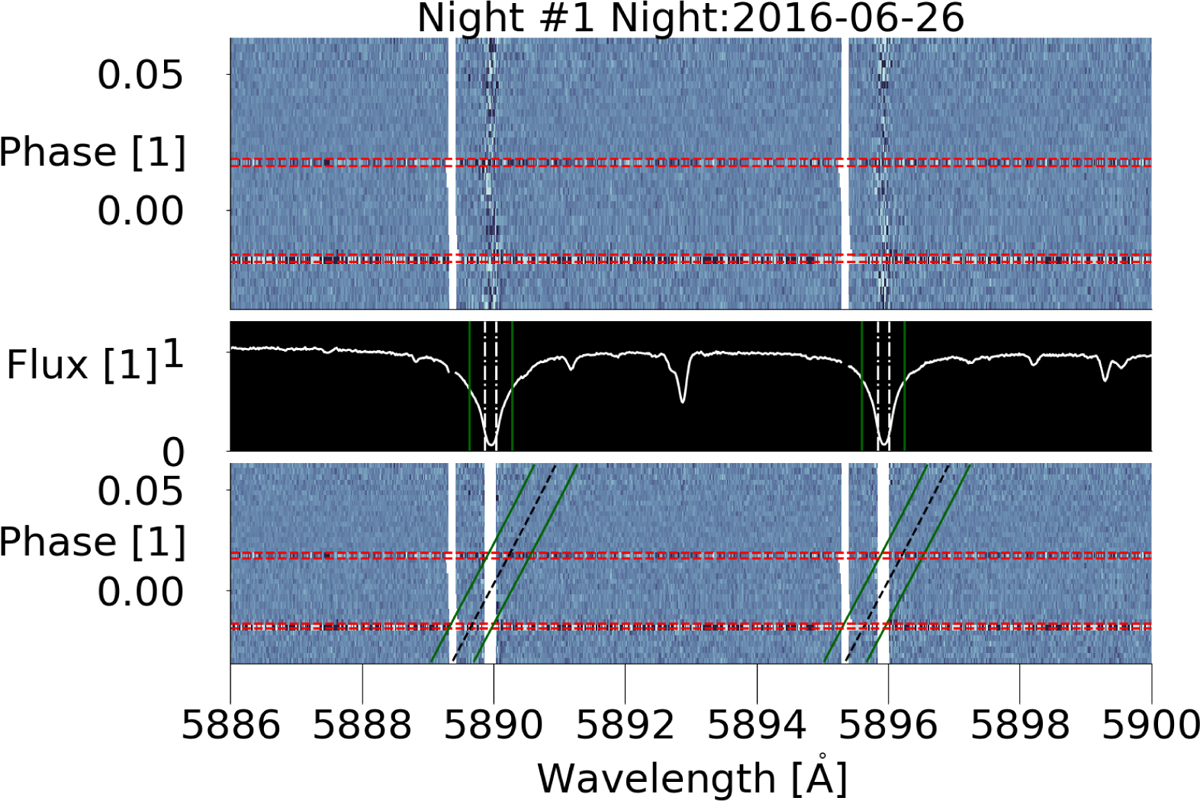
Used mask in the steps as described in Section 5. Top panel: Colormap of all spectra during the first night in the rest frame of the star. The red dashed lines correspond to transit contact points. The white mask is the mask used for telluric sodium, located at roughly –30 km s−1. Middle panel: Master-out spectrum, with the following colored lines: white dash-dot line, masked region; and green, sodium line ![]() region as reported in Seidel et al. (2019). Bottom panel: Masked stellar signal based on the mask shown in the middle panel (white lines), which is still in the rest frame of the star. The black line corresponds to the sodium line in the planetary rest frame, considering no additional shifts (e.g., due to winds). Green lines are offset by
region as reported in Seidel et al. (2019). Bottom panel: Masked stellar signal based on the mask shown in the middle panel (white lines), which is still in the rest frame of the star. The black line corresponds to the sodium line in the planetary rest frame, considering no additional shifts (e.g., due to winds). Green lines are offset by ![]() as used in the middle panel, and they correspond to the area from which we estimated our lost signal. The noisy spectra at ingress and egress (around red dashed line) are due to RM correction and light-curve weighting. These two spectra were not used in the final transmission spectrum.
as used in the middle panel, and they correspond to the area from which we estimated our lost signal. The noisy spectra at ingress and egress (around red dashed line) are due to RM correction and light-curve weighting. These two spectra were not used in the final transmission spectrum.
Current usage metrics show cumulative count of Article Views (full-text article views including HTML views, PDF and ePub downloads, according to the available data) and Abstracts Views on Vision4Press platform.
Data correspond to usage on the plateform after 2015. The current usage metrics is available 48-96 hours after online publication and is updated daily on week days.
Initial download of the metrics may take a while.