Fig. C.2
Download original image
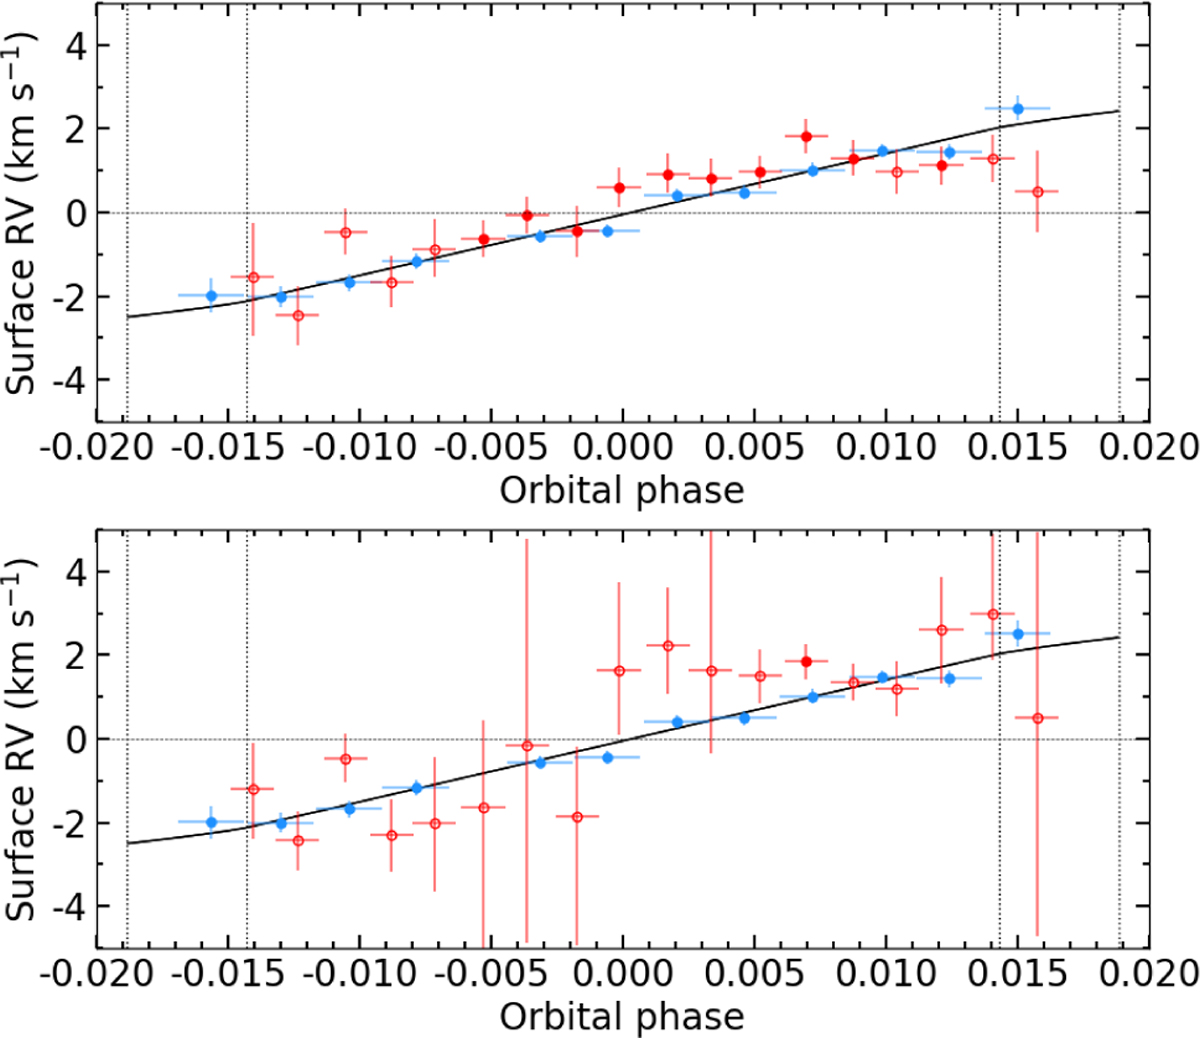
Intrinsic RVs as a function of orbital phase before (top) and after (bottom) the correction for the contrast–S/N correlation, for the 26 June 2016 visit (blue points) and the 21 July 2016 visit (red points). The horizontal dashed line indicates the zero RV level. The vertical dashed lines represent the transit contacts. The solid black line is the analytical RV curve for the adopted values of Table 3.
Current usage metrics show cumulative count of Article Views (full-text article views including HTML views, PDF and ePub downloads, according to the available data) and Abstracts Views on Vision4Press platform.
Data correspond to usage on the plateform after 2015. The current usage metrics is available 48-96 hours after online publication and is updated daily on week days.
Initial download of the metrics may take a while.