Open Access
Fig. B.1
Download original image
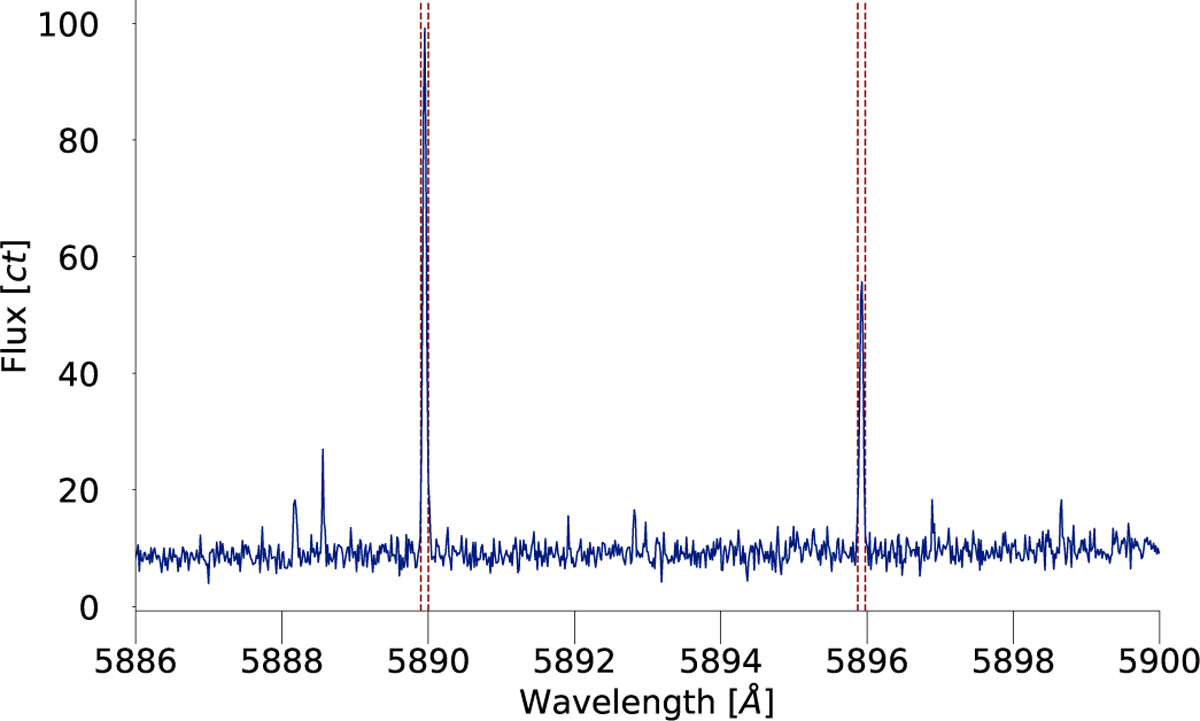
Sodium emission observed on fiber B during the first night of observation. Not correcting for it causes a significant absorption feature. No features were found on fiber B for the wavelength region of Hα. The red dashed line signifies the masked part of the emission.
Current usage metrics show cumulative count of Article Views (full-text article views including HTML views, PDF and ePub downloads, according to the available data) and Abstracts Views on Vision4Press platform.
Data correspond to usage on the plateform after 2015. The current usage metrics is available 48-96 hours after online publication and is updated daily on week days.
Initial download of the metrics may take a while.