Fig. 2
Download original image
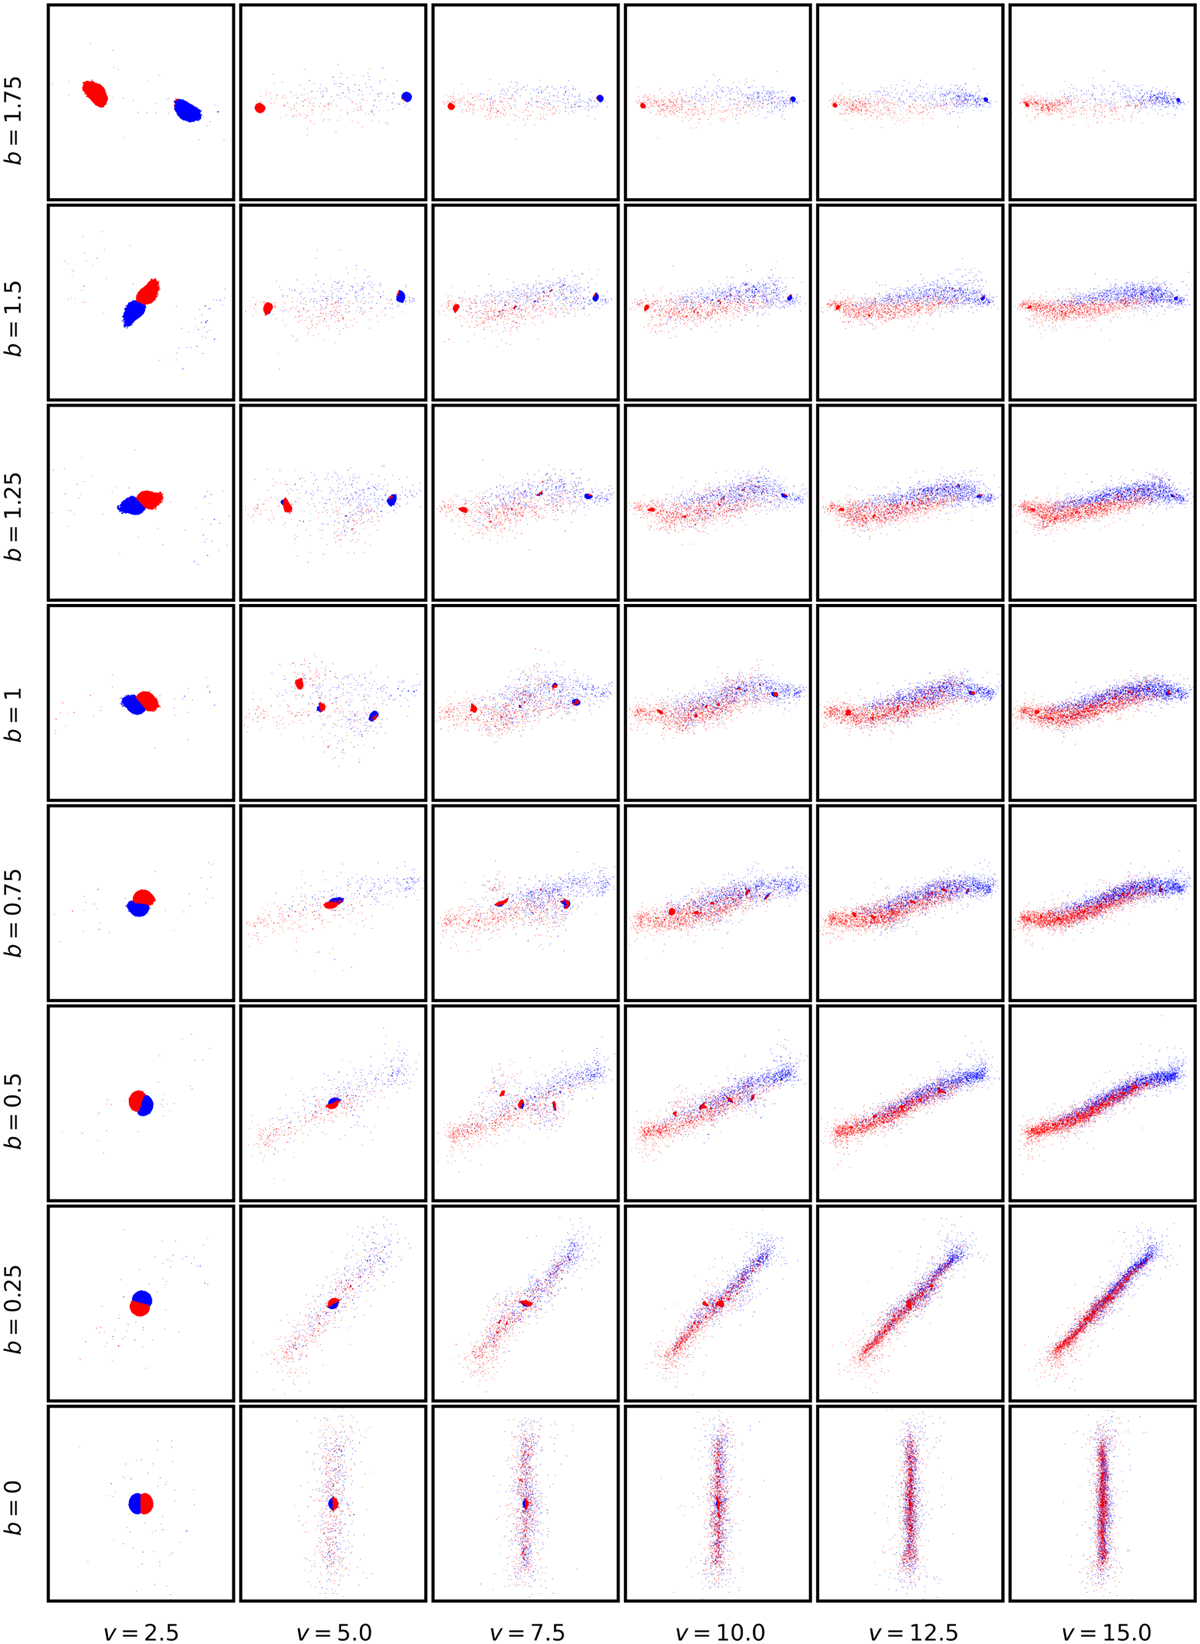
Tableau of the final state after the collision of two aggregates of filling factor 0.28 colliding with velocity υ (in units of m s−1) and reduced impact parameter b. Grains were projected into the plotted plane in order to allow for a better perception of the monomer distribution. Grains are colored according to their initial aggregate affiliation. The size of the subpanels changes with the collision velocity.
Current usage metrics show cumulative count of Article Views (full-text article views including HTML views, PDF and ePub downloads, according to the available data) and Abstracts Views on Vision4Press platform.
Data correspond to usage on the plateform after 2015. The current usage metrics is available 48-96 hours after online publication and is updated daily on week days.
Initial download of the metrics may take a while.