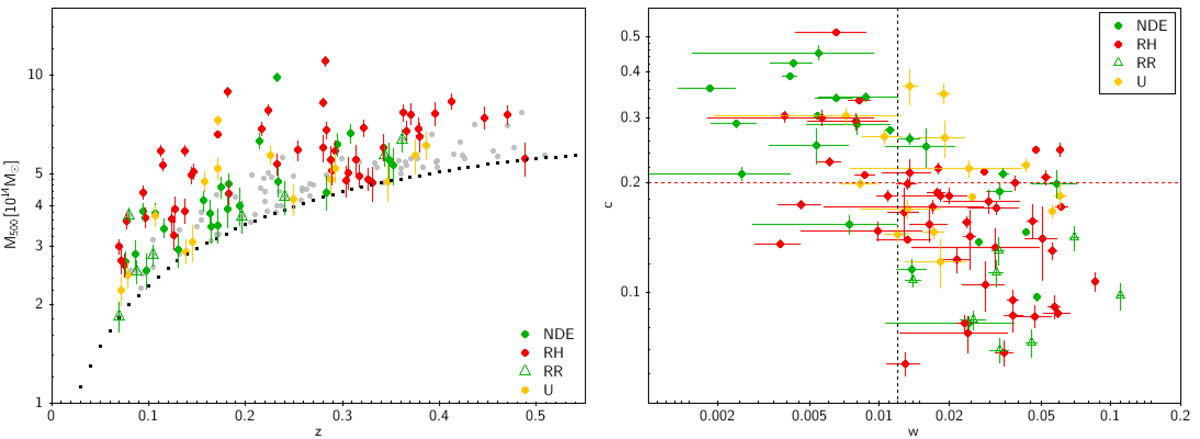
Fig. 8.
Download original image
Left panel: mass-z distribution of the clusters with z = 0.07 − 0.5 above the 50% Planck completeness line: coloured dots show the radio classification of clusters (see figure legend in the panel) that have information about their dynamical status; grey dots are the other clusters of the sample without X-ray observations. Right panel: c − w morphological diagram for the clusters with available X-ray Chandra and/or XMM-Newton data (represented by coloured dots in the right panel). Vertical and horizontal dashed lines are adopted from Cassano et al. (2010b) and are c = 0.2 and w = 0.012.
Current usage metrics show cumulative count of Article Views (full-text article views including HTML views, PDF and ePub downloads, according to the available data) and Abstracts Views on Vision4Press platform.
Data correspond to usage on the plateform after 2015. The current usage metrics is available 48-96 hours after online publication and is updated daily on week days.
Initial download of the metrics may take a while.