Fig. 7.
Download original image
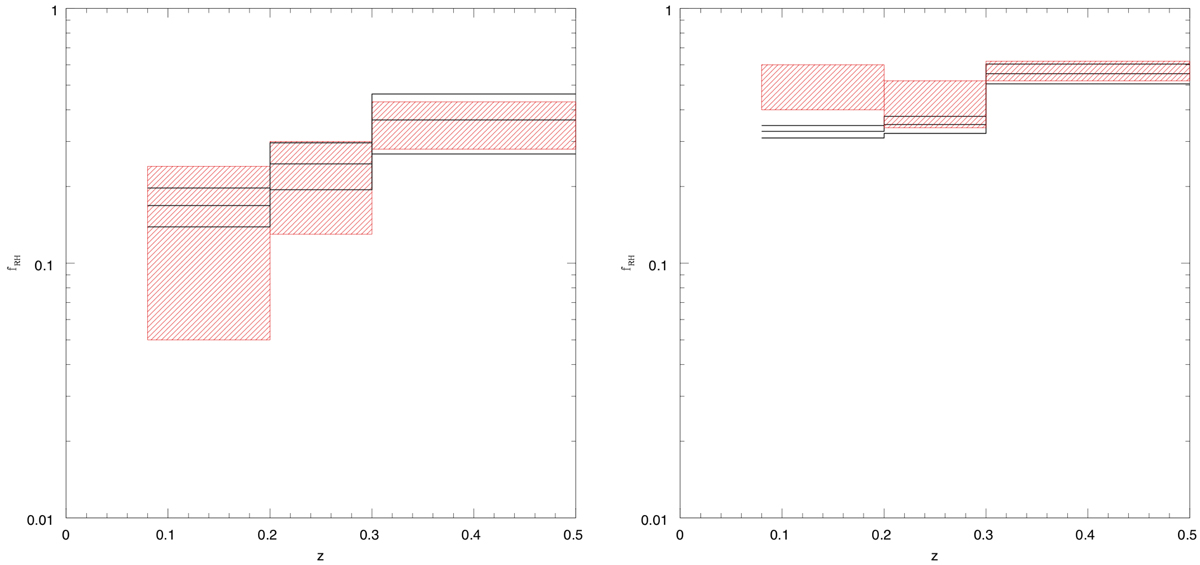
Comparison between expected fractions of clusters with RH (black lines) and observed fRH (red regions) in the three (redshift, mass) bins outlined in Fig. 6. Low-mass bin values are reported in the left panel, and high-mass bin values are plotted in the right panel. For each bin, the reported observed minimum and maximum value of fRH is fRH(MC) with U = no RH case and fRH(MC) with U = RH case, respectively (see Table 1).
Current usage metrics show cumulative count of Article Views (full-text article views including HTML views, PDF and ePub downloads, according to the available data) and Abstracts Views on Vision4Press platform.
Data correspond to usage on the plateform after 2015. The current usage metrics is available 48-96 hours after online publication and is updated daily on week days.
Initial download of the metrics may take a while.