Fig. 6.
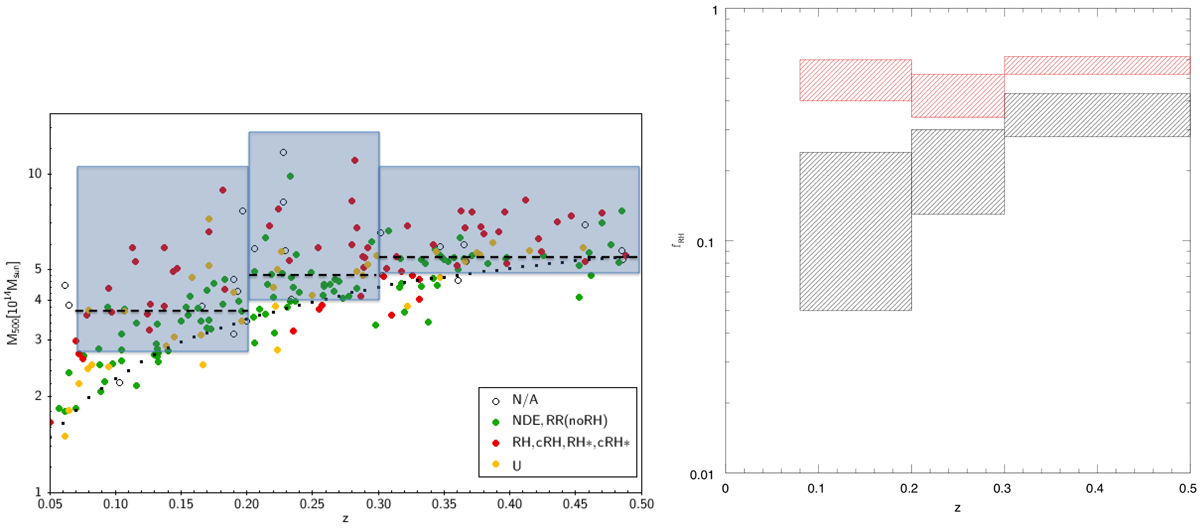
Download original image
Left panel: M500 vs z distribution of the cluster sample. The rectangular regions show the three redshift bins, and within each of them, the dashed line divides the sample into high-mass (above) and low-mass (below) sub-samples. Right panel: fraction of clusters with RHs, fRH, derived in the high-mass sample (red shadowed region) and in the low-mass sample (black shadowed region). For each bin, the reported minimum and maximum values of fRH are fRH(MC) with U = no RH case and fRH(MC) with U = RH case, respectively (see Table 1).
Current usage metrics show cumulative count of Article Views (full-text article views including HTML views, PDF and ePub downloads, according to the available data) and Abstracts Views on Vision4Press platform.
Data correspond to usage on the plateform after 2015. The current usage metrics is available 48-96 hours after online publication and is updated daily on week days.
Initial download of the metrics may take a while.