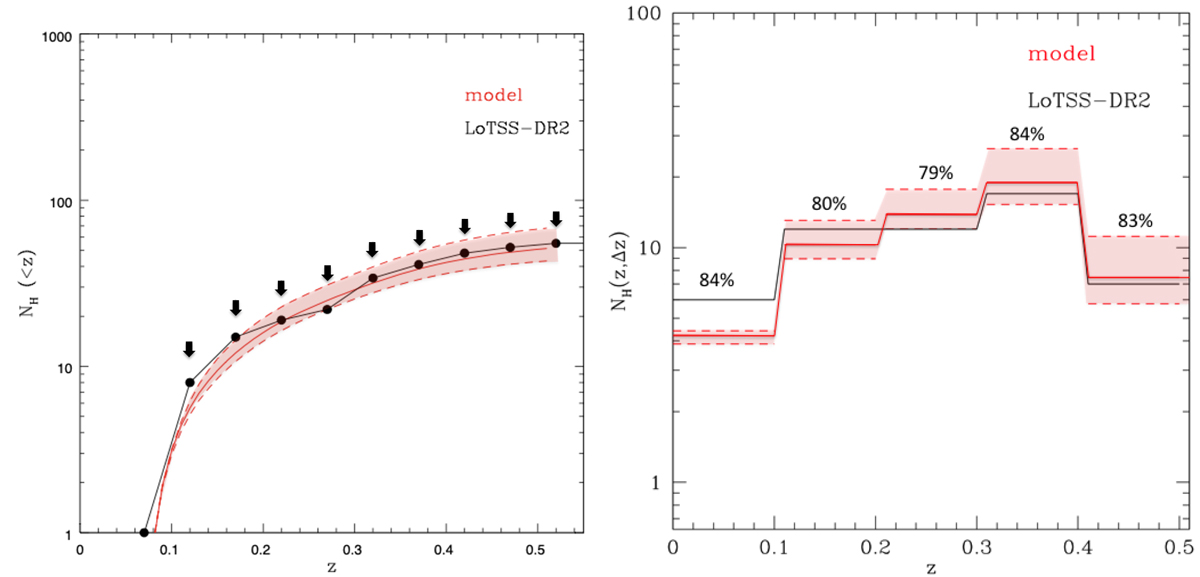
Fig. 5.
Download original image
Number of RH as a function of redshift. Left panel: integral number of RHs within a given redshift NH(< z). The black arrows show the upper boundaries to the total number of RH within that redshift bin that are obtained by adding RH and U cases. Right panel: number of RHs in redshift bins NH(z, Δz); the percentage of RHs with ultra-steep spectra (i.e. νs < 610 MHz) is reported in each redshift bin. In both panels, red lines and regions are the expected values, and black line and dots are the observed values.
Current usage metrics show cumulative count of Article Views (full-text article views including HTML views, PDF and ePub downloads, according to the available data) and Abstracts Views on Vision4Press platform.
Data correspond to usage on the plateform after 2015. The current usage metrics is available 48-96 hours after online publication and is updated daily on week days.
Initial download of the metrics may take a while.