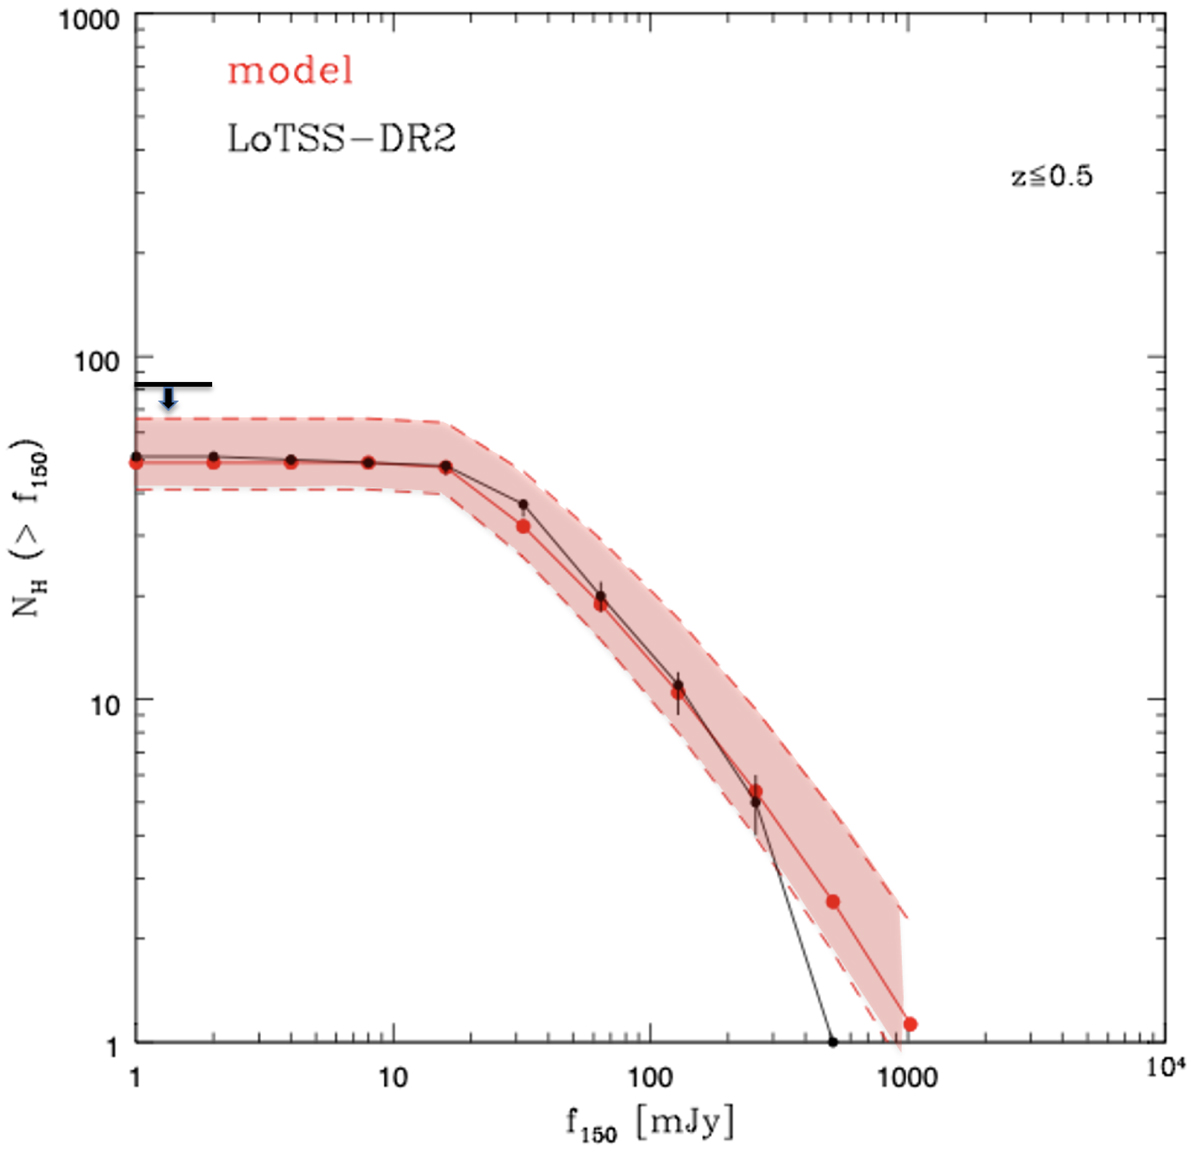
Fig. 4.
Download original image
Expected (red line and region) and observed (black dots) number of RHs in PSZ2 clusters with a flux density greater than f150 and within z ≤ 0.5 in the LoTSS-DR2 area. The black arrow shows the upper boundary to the total number of RHs (due to classification uncertainty), and the bars on the black dots are obtained by a Monte Carlo procedure and represent the errors due to the uncertainties on the flux densities of RHs.
Current usage metrics show cumulative count of Article Views (full-text article views including HTML views, PDF and ePub downloads, according to the available data) and Abstracts Views on Vision4Press platform.
Data correspond to usage on the plateform after 2015. The current usage metrics is available 48-96 hours after online publication and is updated daily on week days.
Initial download of the metrics may take a while.