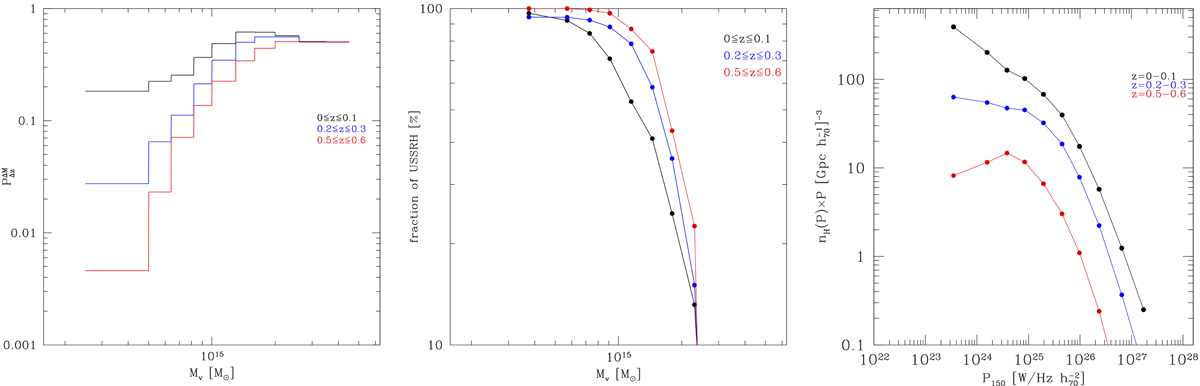
Fig. 3.
Download original image
Model expectations at 150 MHz. Left panel: expected fraction of clusters with RHs with νs ≥ 150 MHz as a function of the cluster mass. Middle panel: expected fraction of RH with very steep radio spectra (νs < 600 MHz) as a function of the cluster mass. Right panel: RH luminosity function at νo = 150 MHz. In all panels, the lines refers to z = 0 − 0.1 (black line), 0.2 − 0.3 (blue line), and 0.5 − 0.6 (red line).
Current usage metrics show cumulative count of Article Views (full-text article views including HTML views, PDF and ePub downloads, according to the available data) and Abstracts Views on Vision4Press platform.
Data correspond to usage on the plateform after 2015. The current usage metrics is available 48-96 hours after online publication and is updated daily on week days.
Initial download of the metrics may take a while.