Fig. 2.
Download original image
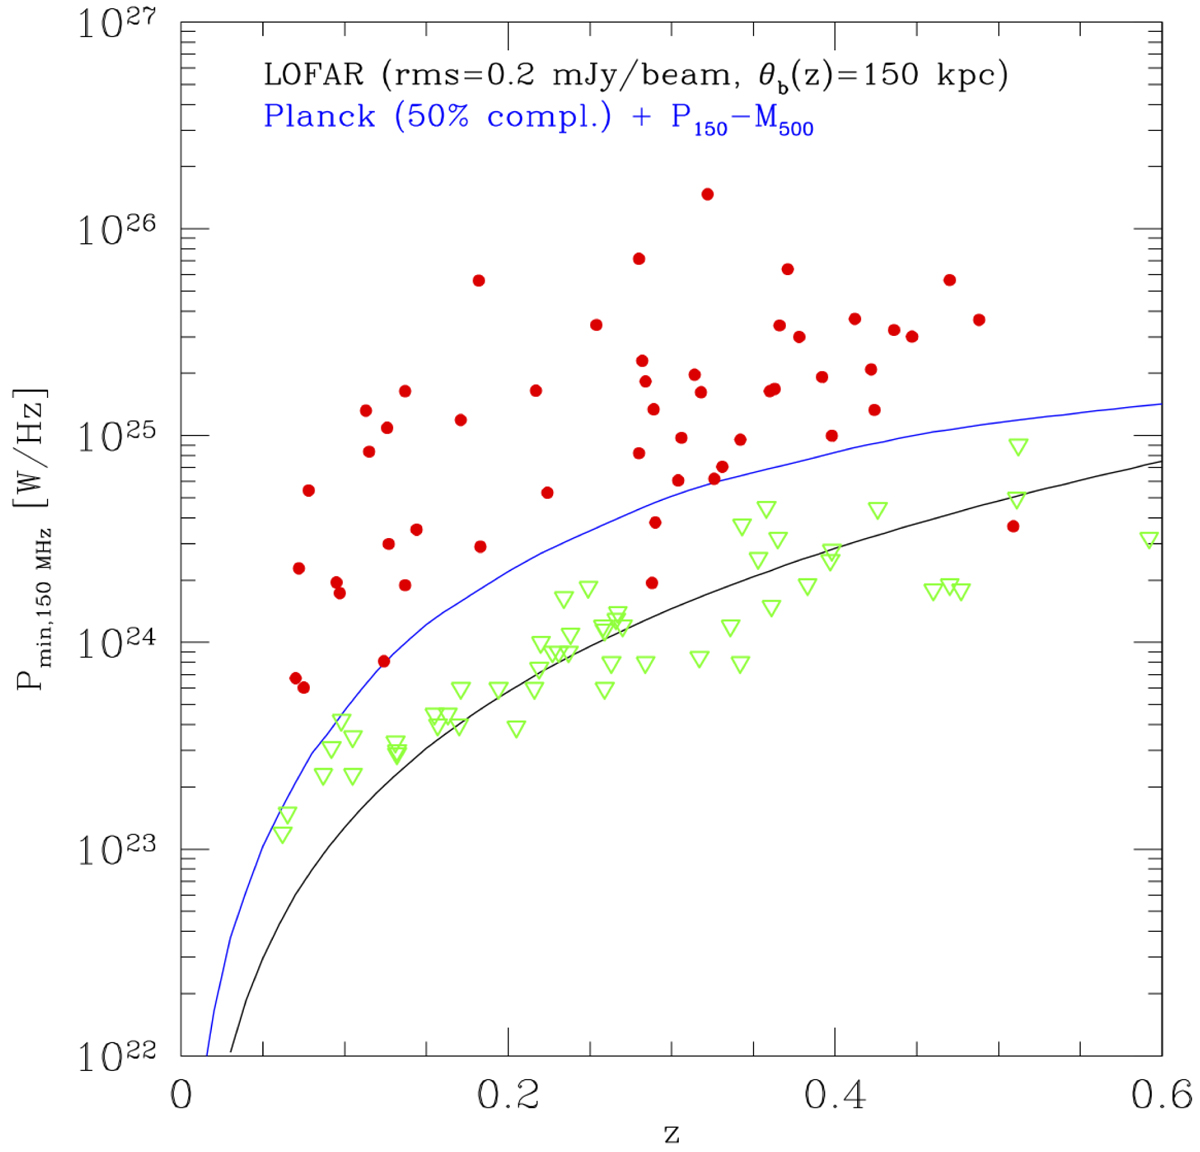
Radio power of haloes (red points) and upper limits (green triangles) as a function of redshift. The minimum radio power derived from Eq. (2) is shown as a black line (parameters are the same as in the figure panel). The blue line has been obtained by combining the P150 MHz − M500 best-fit correlation and the 50% Planck completeness (M, z) line in Fig. 1.
Current usage metrics show cumulative count of Article Views (full-text article views including HTML views, PDF and ePub downloads, according to the available data) and Abstracts Views on Vision4Press platform.
Data correspond to usage on the plateform after 2015. The current usage metrics is available 48-96 hours after online publication and is updated daily on week days.
Initial download of the metrics may take a while.