Open Access
Fig. 1.
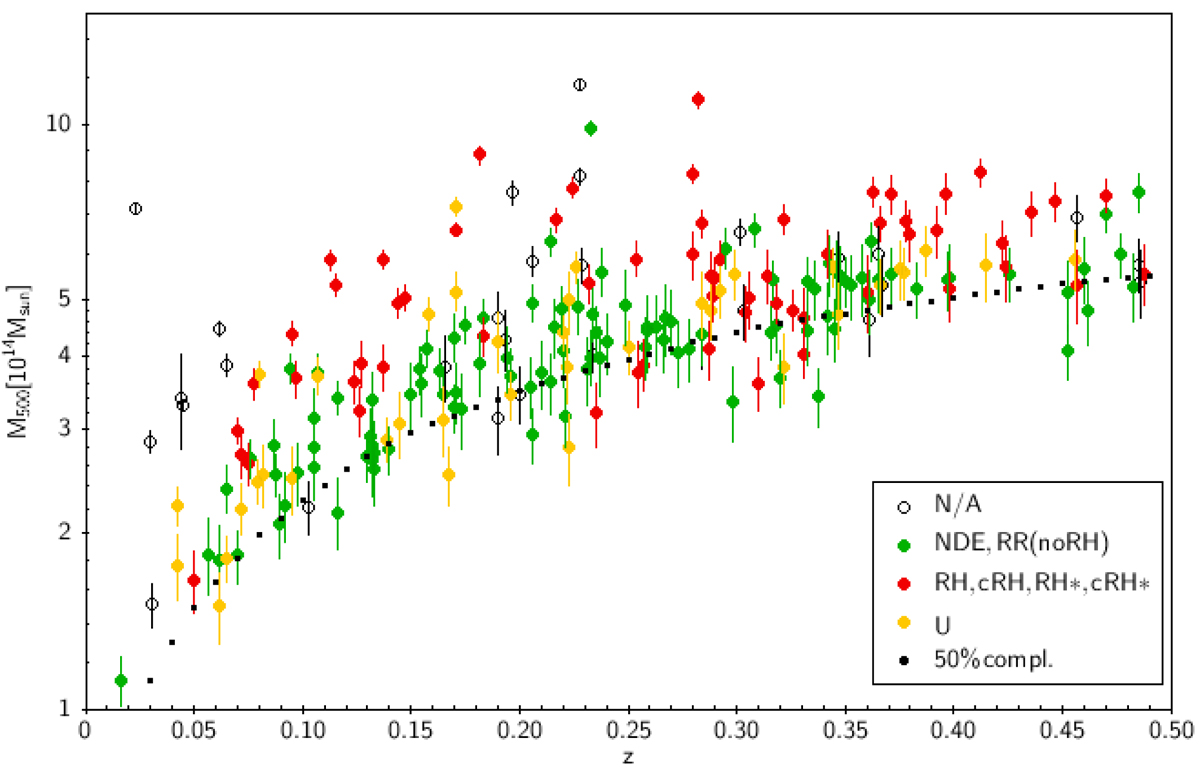
Download original image
Redshift-mass distribution of PSZ2 clusters within the DR2 area up to z = 0.5. The Different colours show the radio classification: N/A (open black dots), NDE and RR with no RH (green dots), RH, cRH, RH* e cRH* (red dots), U (yellow dots). The 50% Planck completeness line is also show (black dotted line).
Current usage metrics show cumulative count of Article Views (full-text article views including HTML views, PDF and ePub downloads, according to the available data) and Abstracts Views on Vision4Press platform.
Data correspond to usage on the plateform after 2015. The current usage metrics is available 48-96 hours after online publication and is updated daily on week days.
Initial download of the metrics may take a while.