Open Access
Fig. 7
Download original image
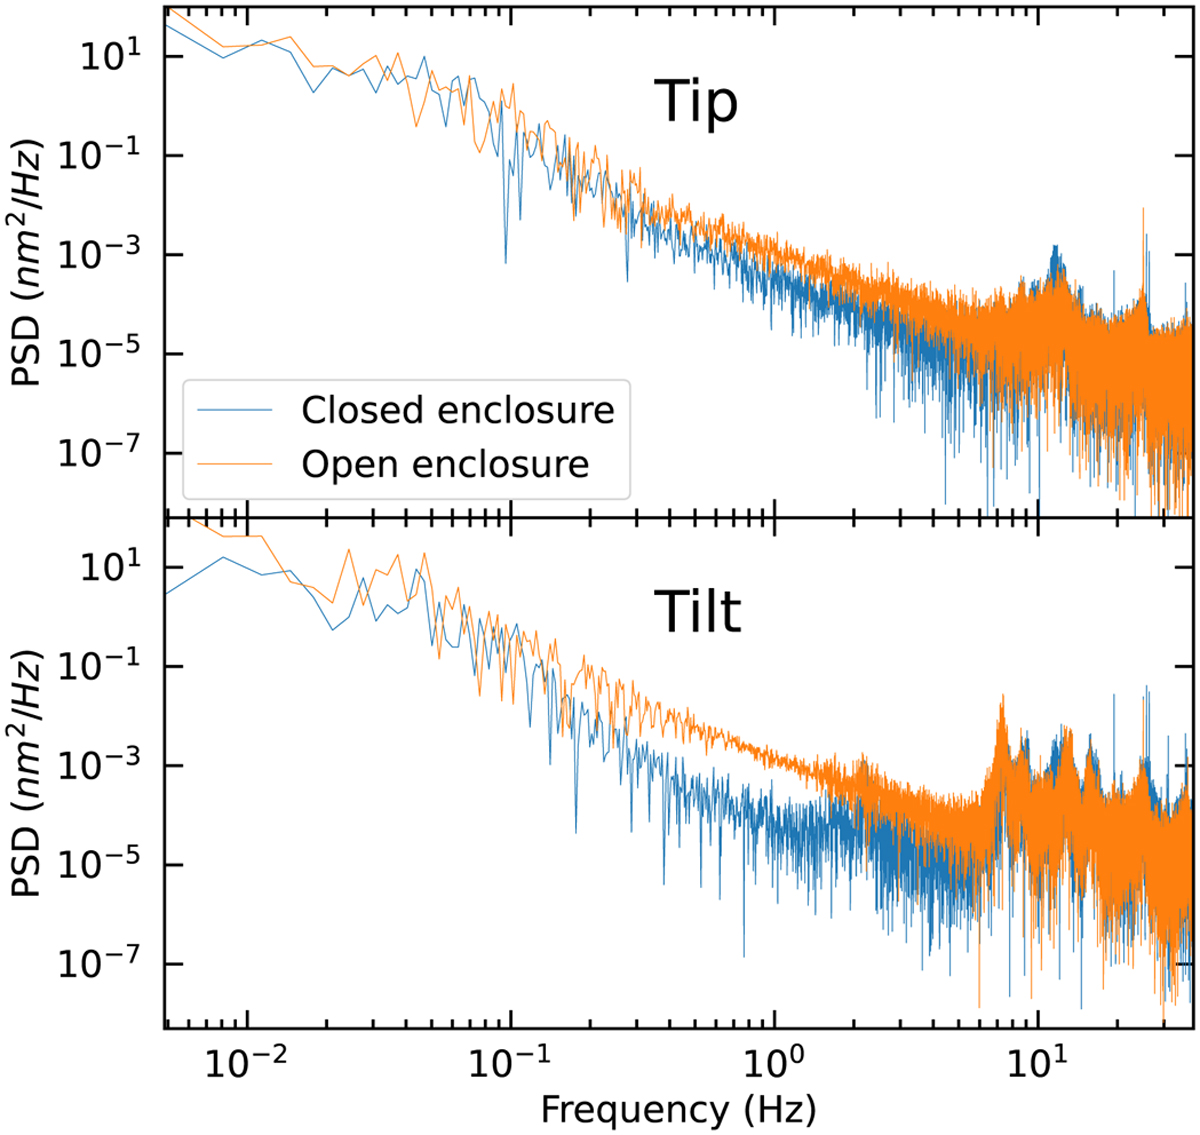
Examples of power spectral density (PSD) of the tip (top) and tilt (bottom) perturbations at the level of the ZWFS on HiCAT. For both modes, a measurement was performed with all the panels closed (in blue) and with an open panel of the enclosure and a high dry air flow (orange).
Current usage metrics show cumulative count of Article Views (full-text article views including HTML views, PDF and ePub downloads, according to the available data) and Abstracts Views on Vision4Press platform.
Data correspond to usage on the plateform after 2015. The current usage metrics is available 48-96 hours after online publication and is updated daily on week days.
Initial download of the metrics may take a while.