Fig. 13
Download original image
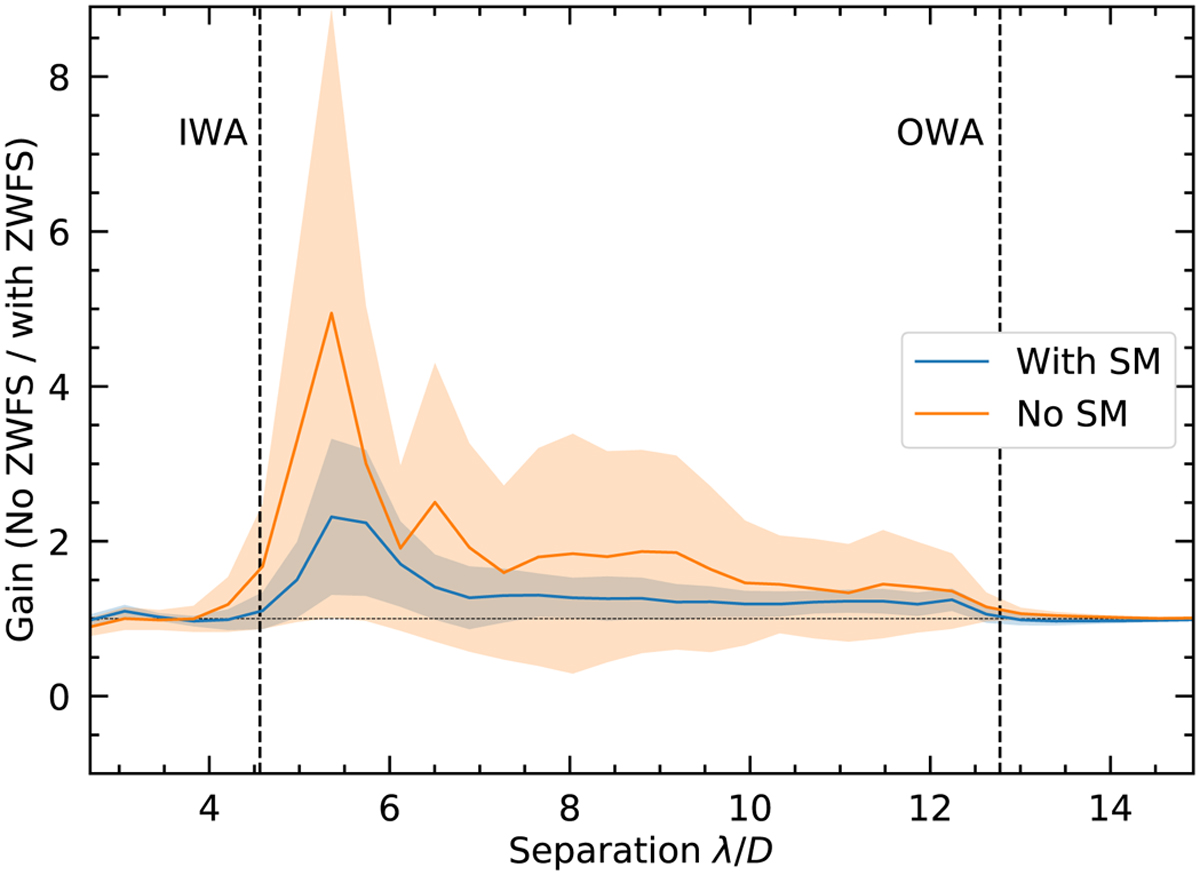
Contrast gain as a function of angular separation in the DH when the HOWFC loop is slowed down to 0.05 Hz on purpose. Solid lines represent the ratio of the azimuthally averaged contrast between the cases without and with LOWFC. The filling colors show the standard deviation of the measurement. The dashed horizontal line is drawn at a gain of 1. The blue curve represents the gain between the values of the intervals (0) and (2) over the values of the intervals (1) and (3). The yellow curve corresponds to intervals (4) values.
Current usage metrics show cumulative count of Article Views (full-text article views including HTML views, PDF and ePub downloads, according to the available data) and Abstracts Views on Vision4Press platform.
Data correspond to usage on the plateform after 2015. The current usage metrics is available 48-96 hours after online publication and is updated daily on week days.
Initial download of the metrics may take a while.