Fig. 11
Download original image
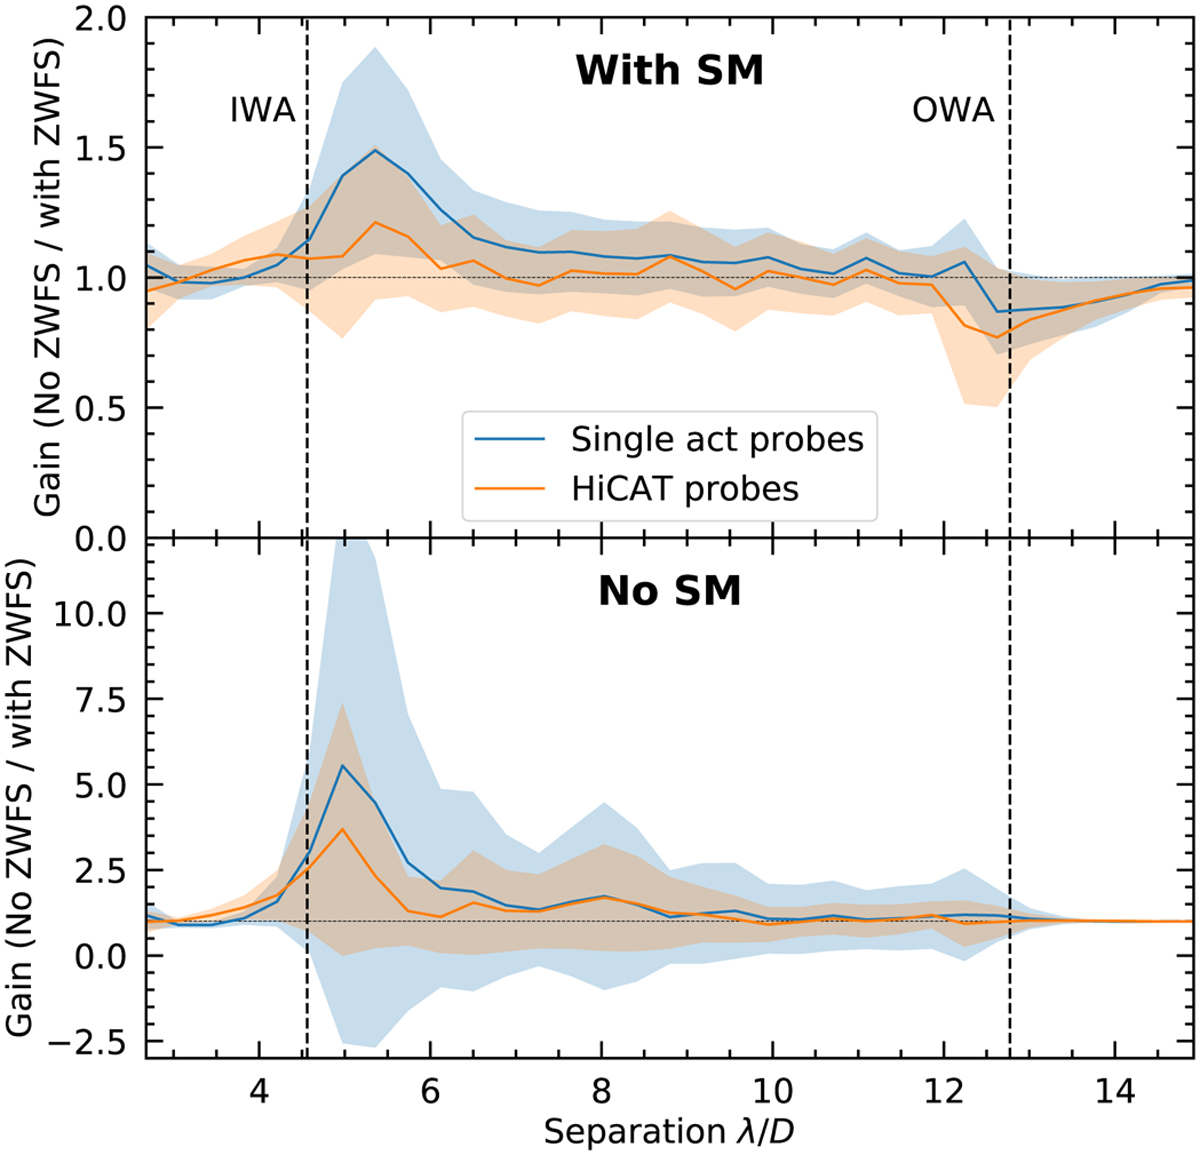
Contrast gain due to ZWFS as a function of angular separation in the DH, for experiments with single-actuator and HiCAT probes. Solid lines represent the ratio of the contrast azimutal average between the cases without and with LOWFC. The filling colors show the standard deviation of the measurement. The dashed horizontal lines are drawn at a gain of 1 in both plots. The top plot represents the values of the intervals (0) and (2) over the values of the intervals (1) and (3). The bottom plot corresponds to the values of the interval (4). The gain lower than 1 at the OWA is due to edge effects in the numerical computation of the contrast.
Current usage metrics show cumulative count of Article Views (full-text article views including HTML views, PDF and ePub downloads, according to the available data) and Abstracts Views on Vision4Press platform.
Data correspond to usage on the plateform after 2015. The current usage metrics is available 48-96 hours after online publication and is updated daily on week days.
Initial download of the metrics may take a while.