Open Access
Fig. 9.
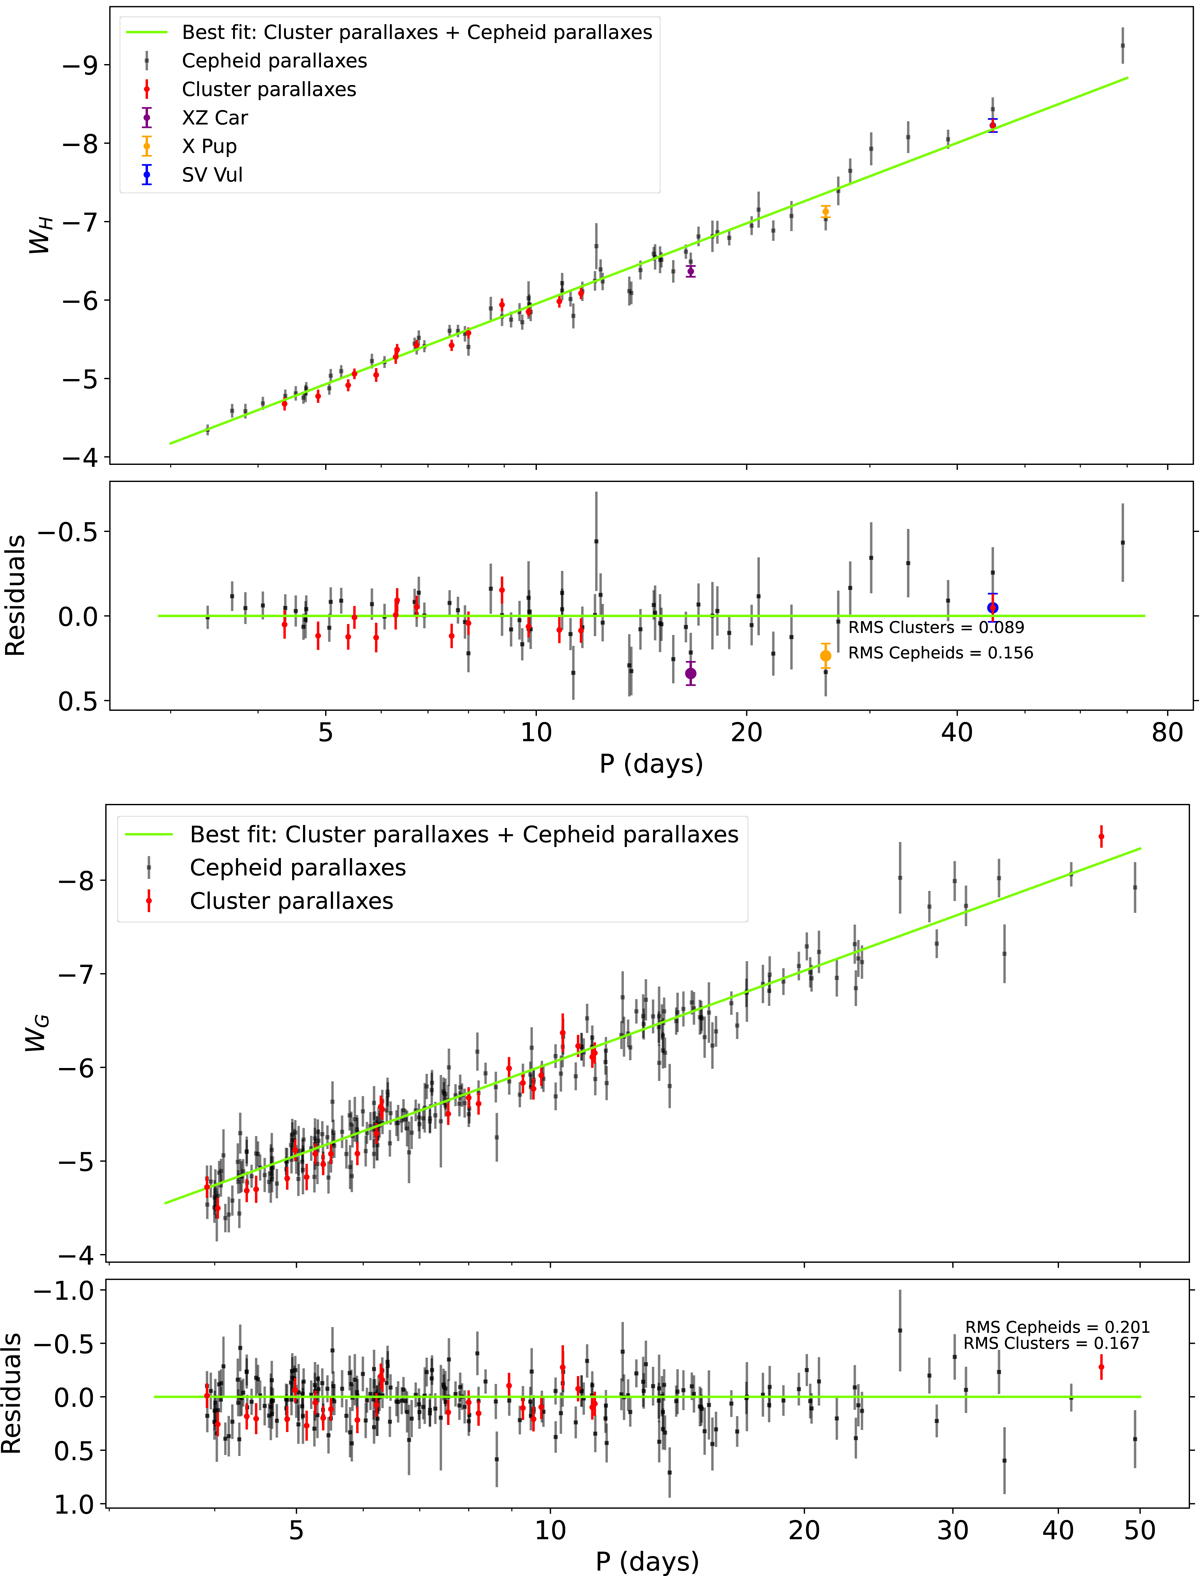
Download original image
LL in the H and G Wesenheit bands. Given the high precision of the Cepheid parallaxes, their individual distances were calculated as 1/ϖ. The plots are shown for illustration purposes, and they were not used to fit the data.
Current usage metrics show cumulative count of Article Views (full-text article views including HTML views, PDF and ePub downloads, according to the available data) and Abstracts Views on Vision4Press platform.
Data correspond to usage on the plateform after 2015. The current usage metrics is available 48-96 hours after online publication and is updated daily on week days.
Initial download of the metrics may take a while.