Fig. 2.
Download original image
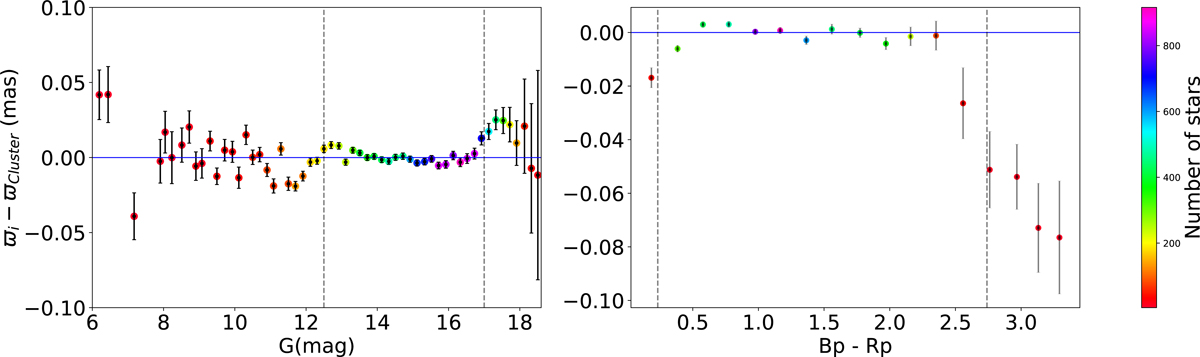
Difference between individual and cluster average parallax for all member stars considered. Left: comparison of the parallax difference as a function of the G magnitude, where the number of stars per bin is color-coded according to the color bar on the right. Right: Same as the left plot, but as a function of the color Bp − Rp. The vertical dotted lines in both panels illustrate the magnitude and color range we used to estimate the cluster parallaxes.
Current usage metrics show cumulative count of Article Views (full-text article views including HTML views, PDF and ePub downloads, according to the available data) and Abstracts Views on Vision4Press platform.
Data correspond to usage on the plateform after 2015. The current usage metrics is available 48-96 hours after online publication and is updated daily on week days.
Initial download of the metrics may take a while.