Open Access
Fig. 9.
Download original image
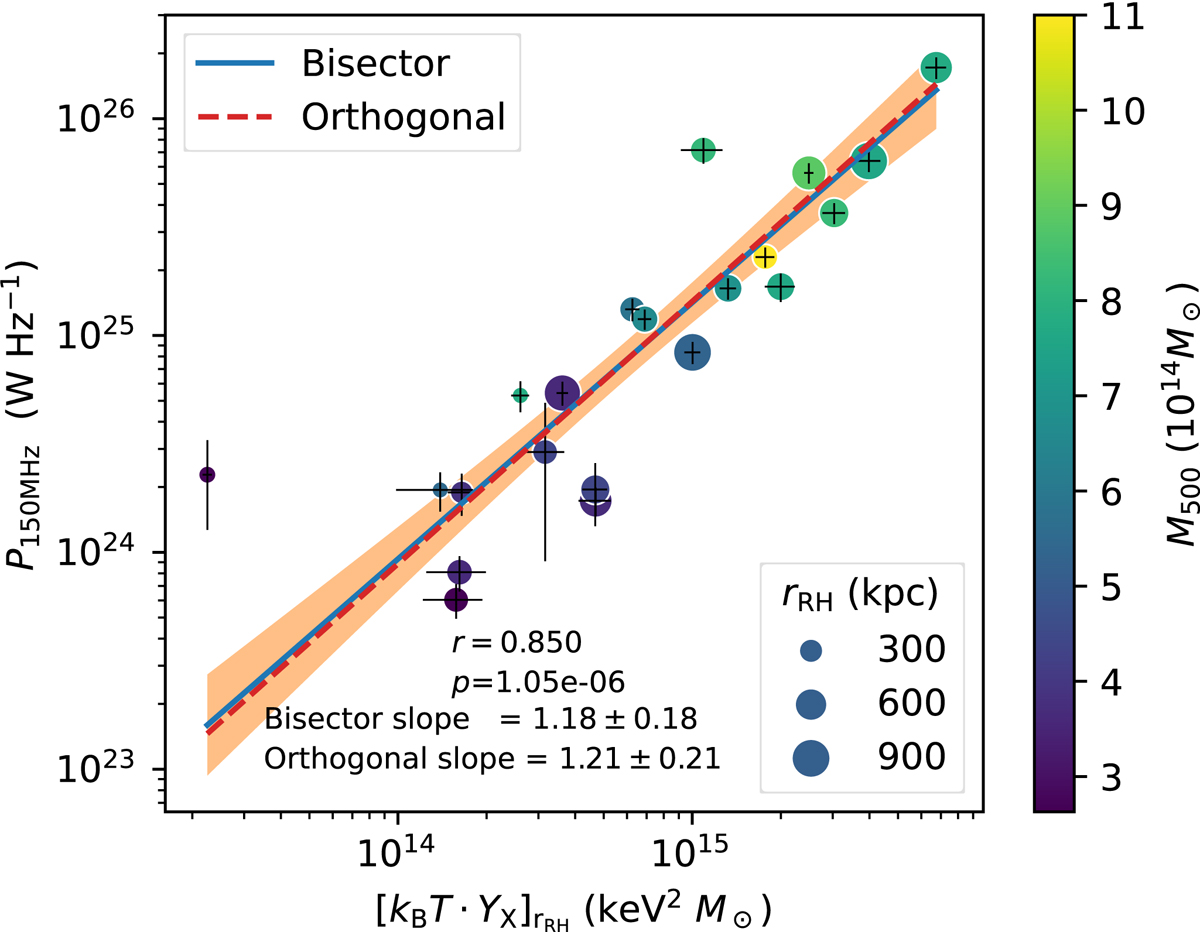
Radio halo power vs. quantity [kBT ⋅ YX]rRH. The marker color indicates cluster M500, and the marker sizes denotes the radio halo radius. Solid and dashed lines represent the best-fit results of BCES bisector and BCES orthogonal, respectively. The orange band is the 1σ confidence band of the BCES bisector fit.
Current usage metrics show cumulative count of Article Views (full-text article views including HTML views, PDF and ePub downloads, according to the available data) and Abstracts Views on Vision4Press platform.
Data correspond to usage on the plateform after 2015. The current usage metrics is available 48-96 hours after online publication and is updated daily on week days.
Initial download of the metrics may take a while.