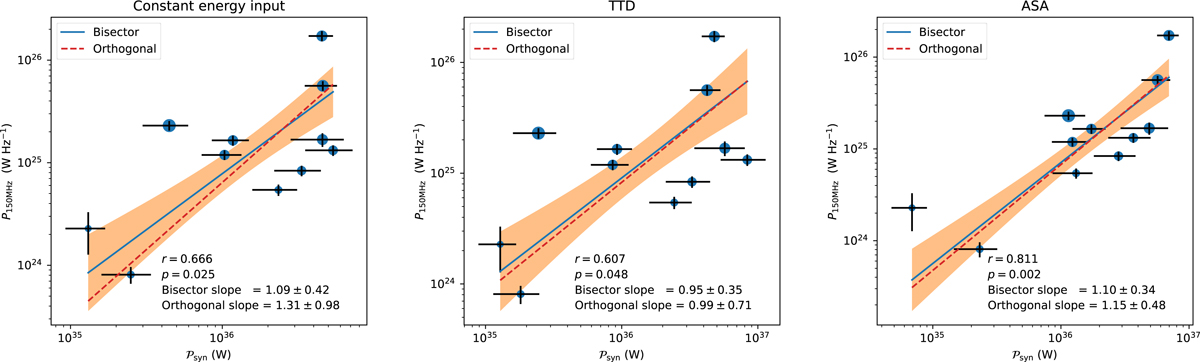
Fig. 8.
Download original image
Radio halo power at 150 MHz vs injection power from turbulent acceleration with constant energy input (left), TTD (middle), and ASA (right), respectively. Solid and dashed lines represent the best-fit results of BCES bisector and BCES orthogonal, respectively. The orange band shows the 1σ confidence band of the BCES bisector fit. The marker size indicates the cluster mass.
Current usage metrics show cumulative count of Article Views (full-text article views including HTML views, PDF and ePub downloads, according to the available data) and Abstracts Views on Vision4Press platform.
Data correspond to usage on the plateform after 2015. The current usage metrics is available 48-96 hours after online publication and is updated daily on week days.
Initial download of the metrics may take a while.