Fig. 3.
Download original image
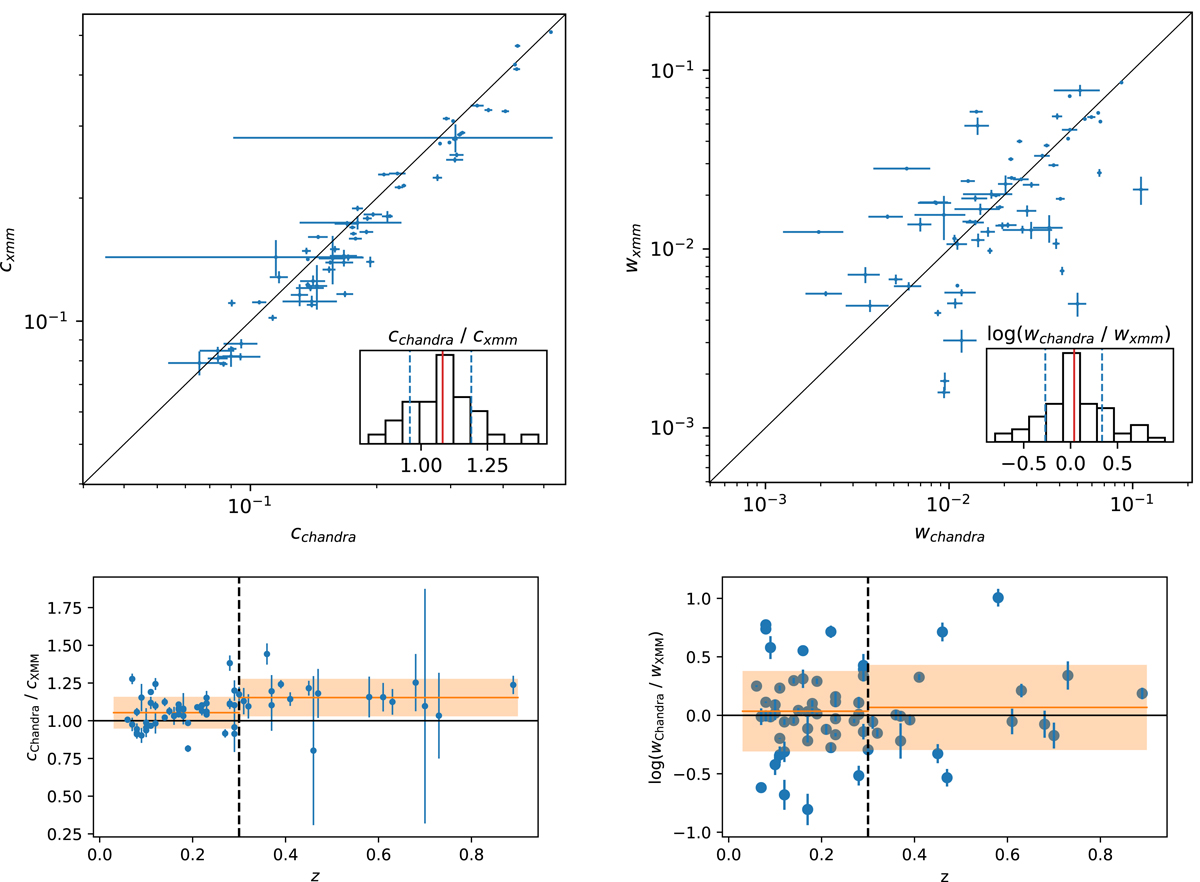
Comparison of Chandra and XMM-Newton morphological parameter measurements. Top left and top right: Chandra vs. XMM-Newton measurements of c and w, respectively. The black lines are the diagonal. In each panel, the subplot is the histogram of the ratio of the measurements from the two telescopes. Dashed vertical red and blue lines indicate the mean and 1σ of the distributions, respectively. The large error bars of two Chandrac measurements are due to low count numbers. Bottom left and bottom right: discrepancy of c and w vs. redshift, respectively. In each panel, the two horizontal orange lines as well as the bands indicate the mean and scatter of the discrepancy of the low- and high-redshift populations.
Current usage metrics show cumulative count of Article Views (full-text article views including HTML views, PDF and ePub downloads, according to the available data) and Abstracts Views on Vision4Press platform.
Data correspond to usage on the plateform after 2015. The current usage metrics is available 48-96 hours after online publication and is updated daily on week days.
Initial download of the metrics may take a while.