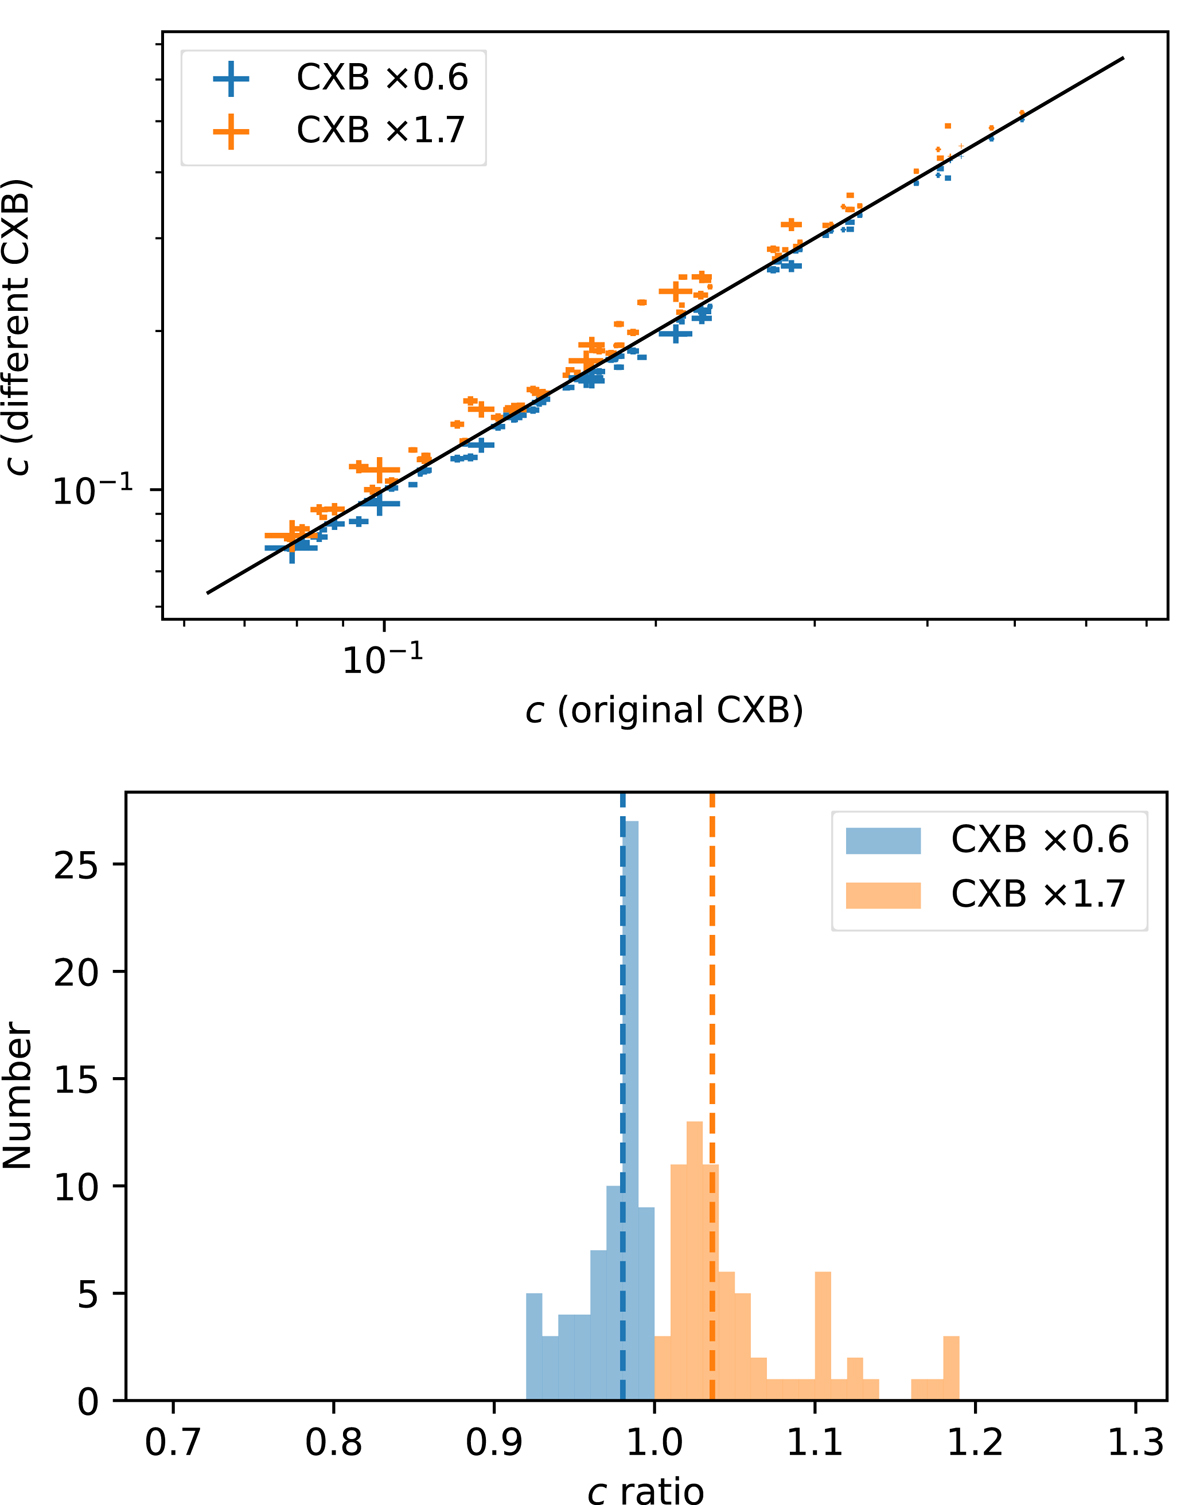
Fig. B.1.
Download original image
Impact of the CXB level adoption on the c measurement. Top: Comparisons between c calculated using 170% (orange) and 60% (blue) CXB levels and the original level for XMM-Newton clusters. The solid line is the diagonal. Bottom: Histograms of the discrepancy of the c values with 170% (orange) and 60% (blue) CXB levels. The dashed lines denote the median values of the two distributions.
Current usage metrics show cumulative count of Article Views (full-text article views including HTML views, PDF and ePub downloads, according to the available data) and Abstracts Views on Vision4Press platform.
Data correspond to usage on the plateform after 2015. The current usage metrics is available 48-96 hours after online publication and is updated daily on week days.
Initial download of the metrics may take a while.