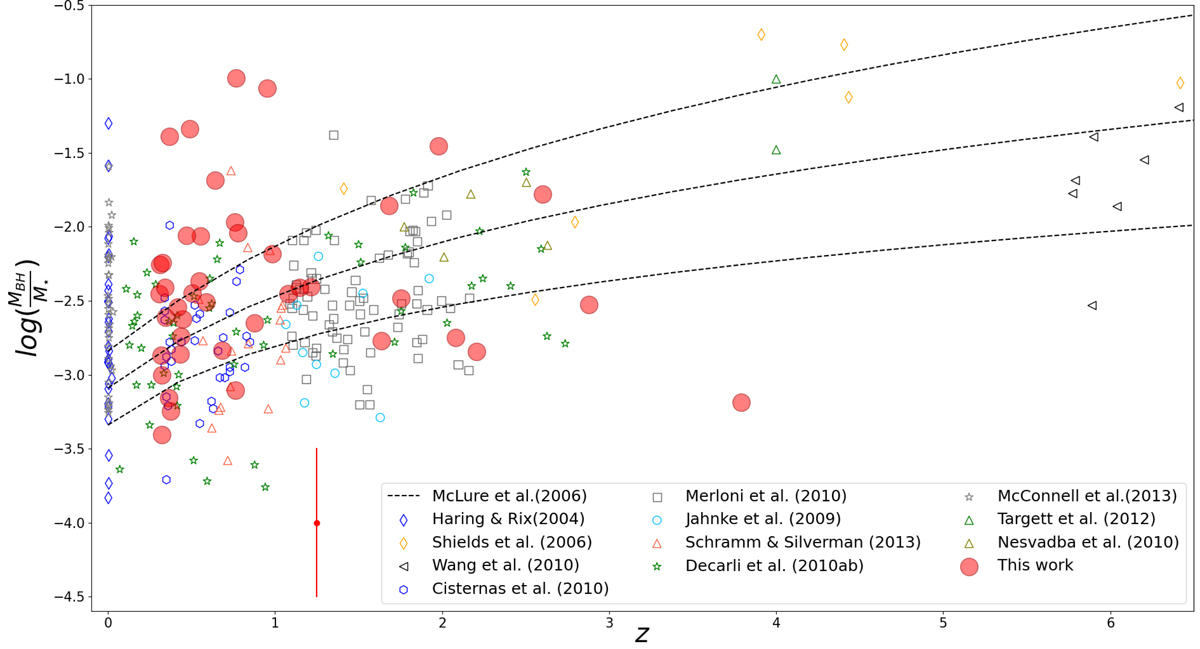
Fig. 5.
Download original image
Black hole to stellar mass ratio as a function of redshift for our sample of radio sources (filled red dots) and for the galaxies in our comparison sample (open symbols). The dashed black lines correspond to the evolutionary model described by McLure et al. (2006), along with the associated 1σ uncertainty. The color-coding is reported in the legend in the bottom right corner. The error bars to the left of the legend show the typical ∼0.5 dex uncertainty in log(MBH/M⋆).
Current usage metrics show cumulative count of Article Views (full-text article views including HTML views, PDF and ePub downloads, according to the available data) and Abstracts Views on Vision4Press platform.
Data correspond to usage on the plateform after 2015. The current usage metrics is available 48-96 hours after online publication and is updated daily on week days.
Initial download of the metrics may take a while.