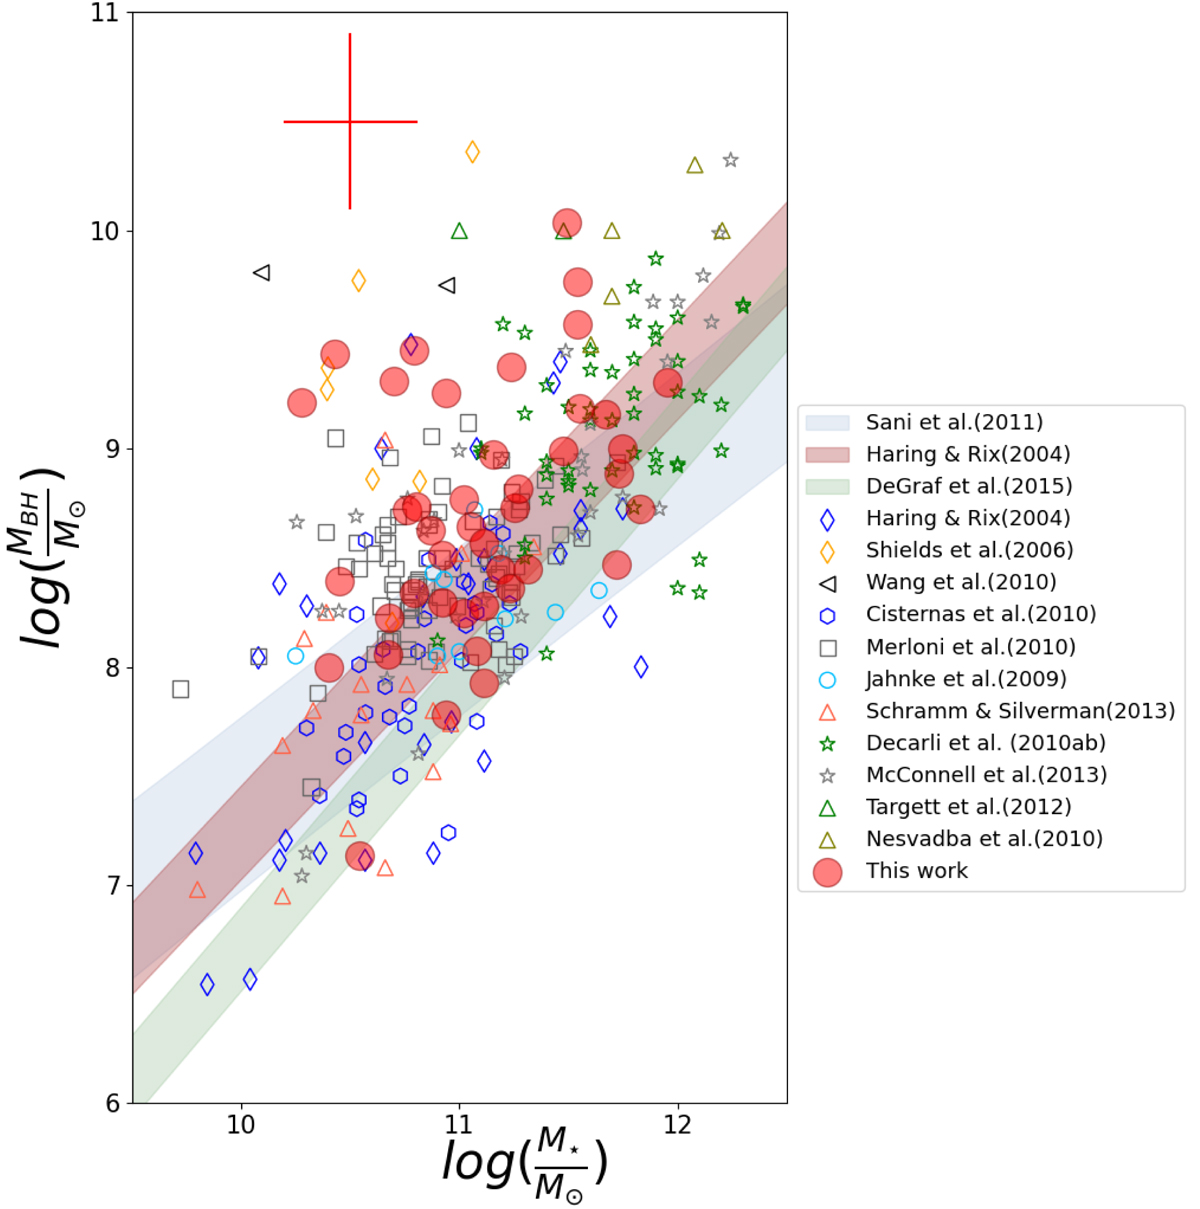
Fig. 4.
Download original image
Scatter plot of black hole vs. stellar mass. Filled red dots correspond to our sample of radio sources, and the sources in the comparison sample are shown as open symbols. Scaling relations are overlaid (Sani et al. 2011; DeGraf et al. 2015; Häring & Rix 2004). The legend at the right displays the adopted color code. The red cross in the top left corner shows the typical uncertainties ∼0.4 dex and ∼0.3 dex for the black hole and stellar masses, respectively.
Current usage metrics show cumulative count of Article Views (full-text article views including HTML views, PDF and ePub downloads, according to the available data) and Abstracts Views on Vision4Press platform.
Data correspond to usage on the plateform after 2015. The current usage metrics is available 48-96 hours after online publication and is updated daily on week days.
Initial download of the metrics may take a while.