Fig. 3.
Download original image
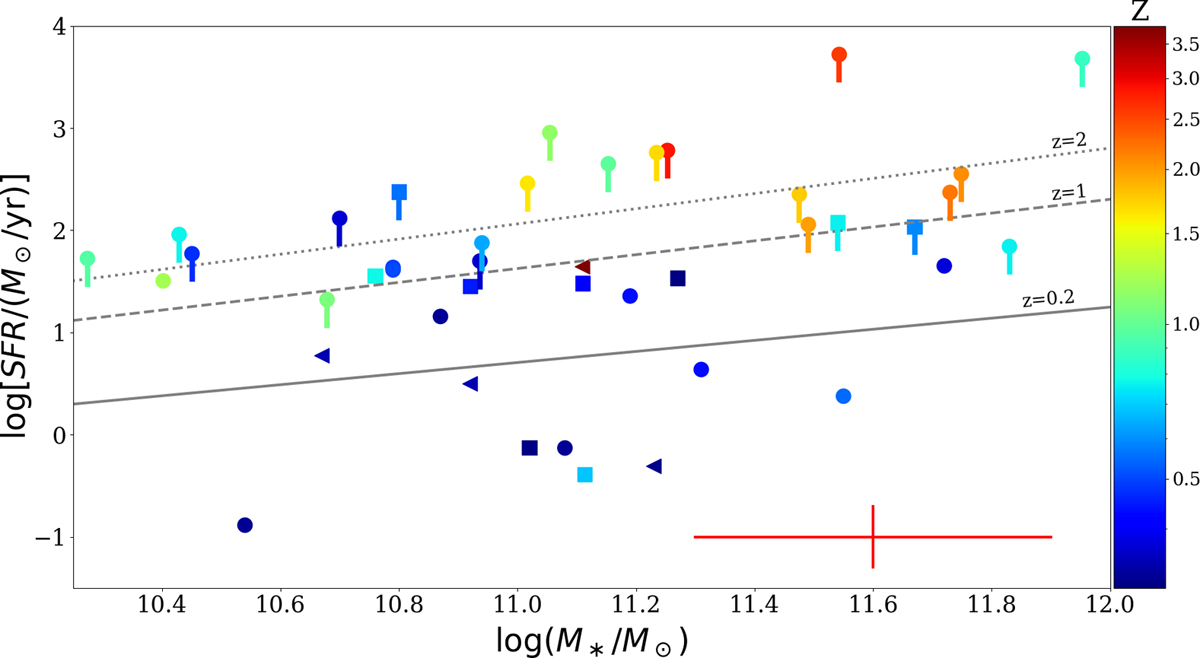
SFR vs. stellar mass for the galaxies in our sample. Sources are color-coded according to their redshift, while the different symbols correspond to the different WISE classes (AGN as circles, starbursts as triangles, and intermediate disks as squares), as in Fig. 1. Upper limits to the SFRs are indicated with arrows. The diagonal lines correspond to the MS model prescriptions by Speagle et al. (2014) at z = 0.2, 1, and 2. The red cross in the bottom right corner shows the typical uncertainties of ∼0.3 dex for both SFRs and stellar masses.
Current usage metrics show cumulative count of Article Views (full-text article views including HTML views, PDF and ePub downloads, according to the available data) and Abstracts Views on Vision4Press platform.
Data correspond to usage on the plateform after 2015. The current usage metrics is available 48-96 hours after online publication and is updated daily on week days.
Initial download of the metrics may take a while.